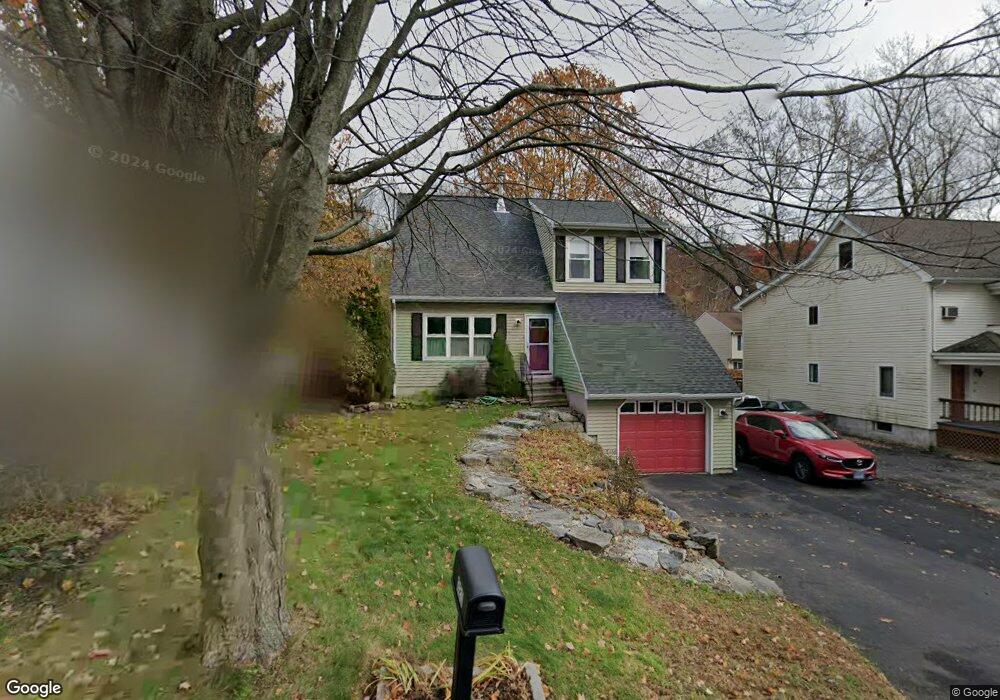
321 Spring St Naugatuck, CT 06770
Estimated Value: $356,247 - $410,000
3
Beds
2
Baths
1,714
Sq Ft
$226/Sq Ft
Est. Value
About This Home
This home is located at 321 Spring St, Naugatuck, CT 06770 and is currently estimated at $387,062, approximately $225 per square foot. 321 Spring St is a home located in New Haven County with nearby schools including City Hill Middle School, Naugatuck High School, and Holy Cross High School.
Ownership History
Date
Name
Owned For
Owner Type
Purchase Details
Closed on
Oct 18, 2012
Sold by
Haydon Frank A and Haydon Nancy M
Bought by
Haydon Frank A and Haydon Nancy M
Current Estimated Value
Home Financials for this Owner
Home Financials are based on the most recent Mortgage that was taken out on this home.
Original Mortgage
$172,975
Outstanding Balance
$120,399
Interest Rate
3.62%
Mortgage Type
FHA
Estimated Equity
$266,663
Purchase Details
Closed on
Nov 30, 1993
Sold by
Corsino Alfred
Bought by
Boyd Reginald and Boyd Linda
Home Financials for this Owner
Home Financials are based on the most recent Mortgage that was taken out on this home.
Original Mortgage
$115,350
Interest Rate
6.72%
Mortgage Type
Purchase Money Mortgage
Create a Home Valuation Report for This Property
The Home Valuation Report is an in-depth analysis detailing your home's value as well as a comparison with similar homes in the area
Home Values in the Area
Average Home Value in this Area
Purchase History
| Date | Buyer | Sale Price | Title Company |
|---|---|---|---|
| Haydon Frank A | -- | -- | |
| Boyd Reginald | $124,900 | -- |
Source: Public Records
Mortgage History
| Date | Status | Borrower | Loan Amount |
|---|---|---|---|
| Open | Boyd Reginald | $172,975 | |
| Previous Owner | Boyd Reginald | $150,818 | |
| Previous Owner | Boyd Reginald | $114,667 | |
| Previous Owner | Boyd Reginald | $115,350 |
Source: Public Records
Tax History
| Year | Tax Paid | Tax Assessment Tax Assessment Total Assessment is a certain percentage of the fair market value that is determined by local assessors to be the total taxable value of land and additions on the property. | Land | Improvement |
|---|---|---|---|---|
| 2025 | $7,083 | $178,010 | $28,840 | $149,170 |
| 2024 | $7,439 | $178,010 | $28,840 | $149,170 |
| 2023 | $7,966 | $178,010 | $28,840 | $149,170 |
| 2022 | $5,953 | $124,680 | $30,730 | $93,950 |
| 2021 | $5,953 | $124,680 | $30,730 | $93,950 |
| 2020 | $5,953 | $124,680 | $30,730 | $93,950 |
| 2019 | $5,891 | $124,680 | $30,730 | $93,950 |
| 2018 | $5,822 | $120,420 | $36,980 | $83,440 |
| 2017 | $5,846 | $120,420 | $36,980 | $83,440 |
| 2016 | $5,740 | $120,420 | $36,980 | $83,440 |
| 2015 | $5,488 | $120,420 | $36,980 | $83,440 |
| 2014 | $5,426 | $120,420 | $36,980 | $83,440 |
| 2012 | $5,382 | $160,410 | $46,690 | $113,720 |
Source: Public Records
Map
Nearby Homes
- 55 Porter Ave Unit 6E
- 23 Thunderbird Dr
- 66 Nancy Ln
- 69 Nancy Ln
- 92A Thunderbird Dr
- 0 Field St Unit 170385250
- 125 Thunderbird Dr
- 461 Spring St Unit 3
- 48 Anderson St
- 545 N Church St
- 40 Ridge Rd Unit 3
- 18 Bridge St Unit 1O
- 48 Round Tree Dr Unit 5
- 465 N Main St
- 30 Coach Cir Unit 1
- 23 Salem St
- 32 Stanley St
- 22 Neagle St
- 309 N Hoadley St
- 167 N Hoadley St
Your Personal Tour Guide
Ask me questions while you tour the home.