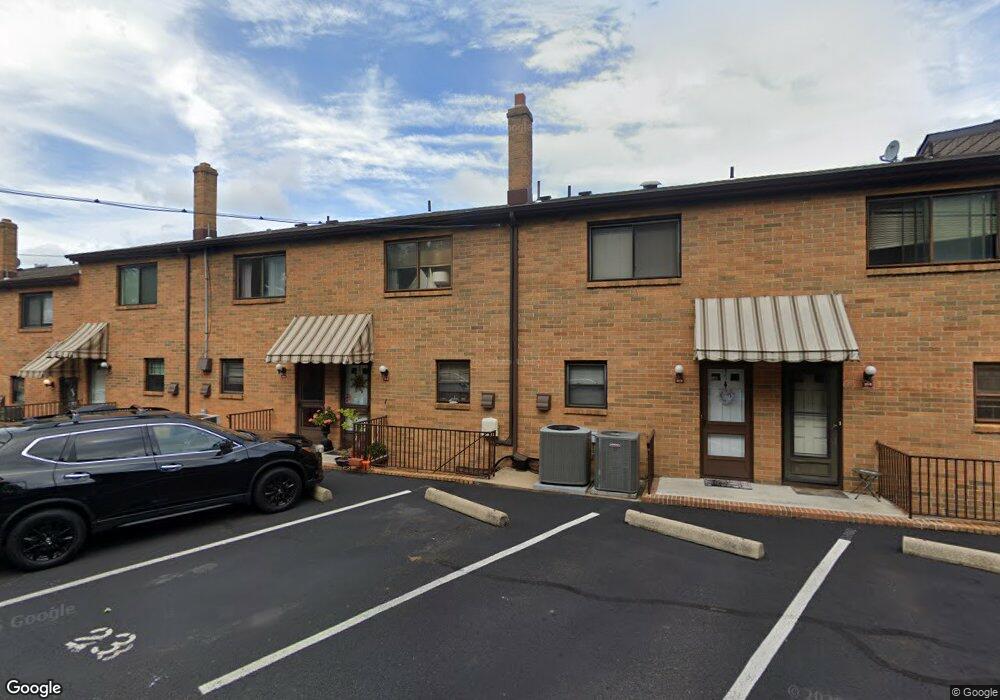
321 Spring St Unit 16 Red Bank, NJ 07701
Estimated Value: $397,368 - $436,000
1
Bed
3
Baths
1,104
Sq Ft
$376/Sq Ft
Est. Value
About This Home
This home is located at 321 Spring St Unit 16, Red Bank, NJ 07701 and is currently estimated at $415,092, approximately $375 per square foot. 321 Spring St Unit 16 is a home located in Monmouth County with nearby schools including Red Bank Primary School, Red Bank Middle School, and Red Bank Regional High School.
Ownership History
Date
Name
Owned For
Owner Type
Purchase Details
Closed on
Oct 27, 2005
Sold by
Mermegas Dion
Bought by
Pepitone Michael F and Pepitone Elizabeth A
Current Estimated Value
Purchase Details
Closed on
Feb 28, 2005
Sold by
Davidson Kirsten
Bought by
Mermegas Dion
Home Financials for this Owner
Home Financials are based on the most recent Mortgage that was taken out on this home.
Original Mortgage
$217,600
Interest Rate
5.66%
Purchase Details
Closed on
Dec 27, 2001
Sold by
Asay Mark
Bought by
Davidson Kirsten and Macaluso Randolph
Home Financials for this Owner
Home Financials are based on the most recent Mortgage that was taken out on this home.
Original Mortgage
$157,350
Interest Rate
7.05%
Mortgage Type
FHA
Purchase Details
Closed on
Mar 3, 1999
Sold by
Fucci Vincent
Bought by
Asay Mark and Asay Pei
Home Financials for this Owner
Home Financials are based on the most recent Mortgage that was taken out on this home.
Original Mortgage
$121,150
Interest Rate
6.76%
Create a Home Valuation Report for This Property
The Home Valuation Report is an in-depth analysis detailing your home's value as well as a comparison with similar homes in the area
Home Values in the Area
Average Home Value in this Area
Purchase History
| Date | Buyer | Sale Price | Title Company |
|---|---|---|---|
| Pepitone Michael F | $315,000 | -- | |
| Mermegas Dion | -- | -- | |
| Davidson Kirsten | $161,000 | -- | |
| Asay Mark | $124,900 | -- |
Source: Public Records
Mortgage History
| Date | Status | Borrower | Loan Amount |
|---|---|---|---|
| Previous Owner | Mermegas Dion | $217,600 | |
| Previous Owner | Davidson Kirsten | $157,350 | |
| Previous Owner | Asay Mark | $121,150 |
Source: Public Records
Tax History Compared to Growth
Tax History
| Year | Tax Paid | Tax Assessment Tax Assessment Total Assessment is a certain percentage of the fair market value that is determined by local assessors to be the total taxable value of land and additions on the property. | Land | Improvement |
|---|---|---|---|---|
| 2025 | $6,478 | $325,000 | $220,000 | $105,000 |
| 2024 | $6,478 | $325,000 | $180,000 | $145,000 |
| 2023 | $6,478 | $339,000 | $168,100 | $170,900 |
| 2022 | $6,689 | $298,600 | $135,000 | $163,600 |
| 2021 | $6,496 | $299,000 | $150,000 | $149,000 |
| 2020 | $6,496 | $285,900 | $150,000 | $135,900 |
| 2019 | $6,233 | $281,900 | $150,000 | $131,900 |
| 2018 | $6,058 | $277,000 | $150,000 | $127,000 |
| 2017 | $5,570 | $264,000 | $135,000 | $129,000 |
| 2016 | $5,299 | $251,500 | $125,000 | $126,500 |
| 2015 | $4,751 | $233,700 | $127,000 | $106,700 |
| 2014 | $4,471 | $233,700 | $127,000 | $106,700 |
Source: Public Records
Map
Nearby Homes
- 283 Spring St Unit 1C
- 30 Crest Dr
- 61 Tower Hill Dr Unit 708
- 32 Woodbine Ave
- 83 Tower Hill Dr
- 4 Manor Dr
- 81 Pinckney Rd
- 87 Rumson Rd
- 58 Hudson Ave
- 70 Hudson Ave
- 82 Linden Place
- 135 Harrison Ave
- 44 Hudson Ave
- 48 Hudson Ave
- 40 Worthley St
- 69 Washington St
- 65 Washington St
- 172 Woods End Dr
- 17 Leroy Place Unit 1A
- 17 Leroy Place Unit 2B
- 321 Spring St Unit 15
- 321 Spring St Unit 17
- 321 Spring St Unit 19
- 321 Spring St Unit 1
- 321 Spring St Unit 30
- 321 Spring St Unit 26
- 321 Spring St Unit 24
- 321 Spring St Unit 22
- 321 Spring St Unit 7
- 321 Spring St Unit 14
- 321 Spring St Unit 21
- 321 Spring St Unit 11
- 321 Spring St Unit 2
- 321 Spring St Unit 5
- 321 Spring St Unit 10
- 321 Spring St Unit 27
- 321 Spring St Unit 29
- 321 Spring St Unit 28
- 321 Spring St Unit 31
- 321 Spring St Unit 25