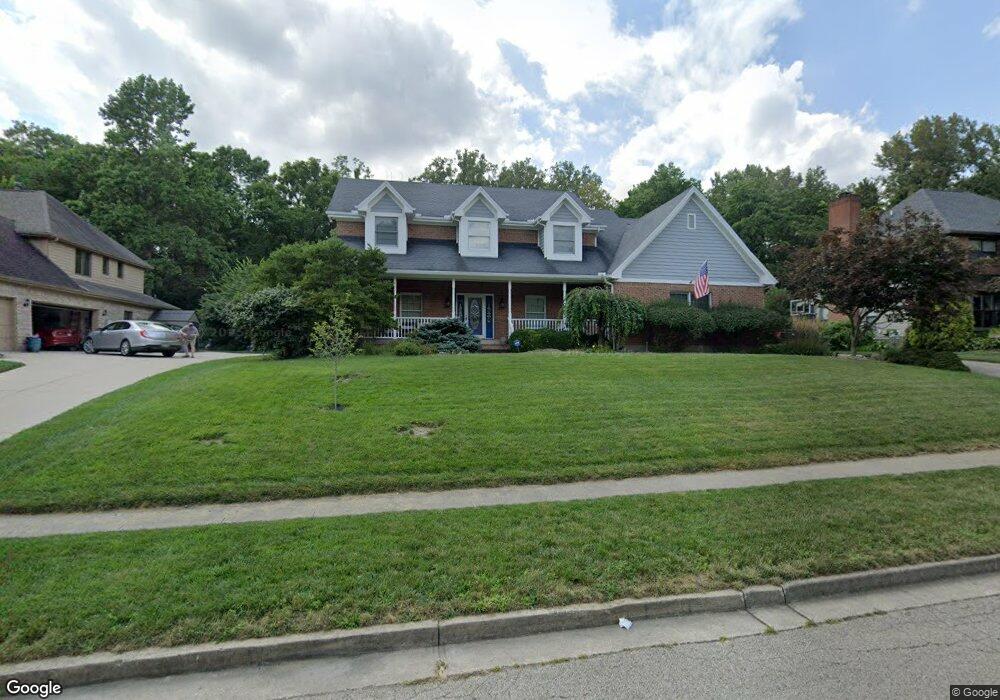
321 Timberleaf Dr Beavercreek, OH 45430
Estimated Value: $593,000 - $711,000
4
Beds
5
Baths
3,574
Sq Ft
$177/Sq Ft
Est. Value
About This Home
This home is located at 321 Timberleaf Dr, Beavercreek, OH 45430 and is currently estimated at $633,791, approximately $177 per square foot. 321 Timberleaf Dr is a home located in Greene County with nearby schools including Fairbrook Elementary School, Herman K Ankeney Middle School, and Beavercreek High School.
Ownership History
Date
Name
Owned For
Owner Type
Purchase Details
Closed on
Jul 3, 2018
Sold by
Cabeen Eric D and Cabeen Kristina L
Bought by
Moro Erik A and Moro Lauren H
Current Estimated Value
Home Financials for this Owner
Home Financials are based on the most recent Mortgage that was taken out on this home.
Original Mortgage
$235,000
Interest Rate
4.5%
Mortgage Type
New Conventional
Purchase Details
Closed on
Apr 10, 2008
Sold by
Coleman Frederick and Coleman Martha B
Bought by
Cabeen Eric D and Cabeen Kristina L
Home Financials for this Owner
Home Financials are based on the most recent Mortgage that was taken out on this home.
Original Mortgage
$337,250
Interest Rate
6.17%
Mortgage Type
Unknown
Purchase Details
Closed on
Mar 14, 1995
Sold by
Coberly Leon T
Bought by
Frederick and Frederick Coleman B
Home Financials for this Owner
Home Financials are based on the most recent Mortgage that was taken out on this home.
Original Mortgage
$252,000
Interest Rate
9.13%
Mortgage Type
New Conventional
Create a Home Valuation Report for This Property
The Home Valuation Report is an in-depth analysis detailing your home's value as well as a comparison with similar homes in the area
Home Values in the Area
Average Home Value in this Area
Purchase History
| Date | Buyer | Sale Price | Title Company |
|---|---|---|---|
| Moro Erik A | $415,000 | None Available | |
| Cabeen Eric D | $355,000 | Attorney | |
| Frederick | $297,900 | -- |
Source: Public Records
Mortgage History
| Date | Status | Borrower | Loan Amount |
|---|---|---|---|
| Previous Owner | Moro Erik A | $235,000 | |
| Previous Owner | Cabeen Eric D | $337,250 | |
| Previous Owner | Frederick | $252,000 |
Source: Public Records
Tax History
| Year | Tax Paid | Tax Assessment Tax Assessment Total Assessment is a certain percentage of the fair market value that is determined by local assessors to be the total taxable value of land and additions on the property. | Land | Improvement |
|---|---|---|---|---|
| 2024 | $10,835 | $164,370 | $31,850 | $132,520 |
| 2023 | $10,731 | $164,370 | $31,850 | $132,520 |
| 2022 | $10,163 | $137,420 | $24,500 | $112,920 |
| 2021 | $9,957 | $137,420 | $24,500 | $112,920 |
| 2020 | $10,032 | $137,420 | $24,500 | $112,920 |
| 2019 | $10,790 | $132,220 | $22,020 | $110,200 |
| 2018 | $9,550 | $131,960 | $22,020 | $109,940 |
| 2017 | $8,690 | $131,960 | $22,020 | $109,940 |
| 2016 | $8,690 | $116,530 | $22,020 | $94,510 |
| 2015 | $8,640 | $116,530 | $22,020 | $94,510 |
| 2014 | $8,515 | $116,530 | $22,020 | $94,510 |
Source: Public Records
Map
Nearby Homes
- 3785 Frostwood Dr
- 3597 Echo Hill Ln
- 615 Bendwood Way
- 438 Grange Hall Rd
- 3867 Lofty Oaks Dr
- 3978 Indian Ripple Rd
- 3414 Shakertown Rd
- 185 Bramblebush Trail
- 635 Breckenridge Way
- 3392 Greenburn Rd Unit 3392
- 197 Bramblebush Trail
- 205 Elmwood Place
- 25 Martingham Ct Unit 25
- 3985 Shagbark Ln
- 208 Glenview Dr
- 713 Newton Dr
- 3691 Southbrook Dr
- 2658 Tompkins Place
- 457 Merrick Dr
- 281 Locust Ct
- 333 Timberleaf Dr
- 311 Timberleaf Dr
- 0 Aspen Trail
- 268 Aspen Trail
- 326 Aspen Trail
- 343 Timberleaf Dr
- 303 Timberleaf Dr
- 338 Aspen Trail
- 326 Timberleaf Dr
- 316 Timberleaf Dr
- 338 Timberleaf Dr
- 287 Timberleaf Dr
- 308 Timberleaf Dr
- 355 Timberleaf Dr
- 344 Aspen Trail
- 320 Aspen Trail
- 270 Aspen Brook Ct
- 268 Aspen Brook Dr
- 279 Timberleaf Dr
- 300 Timberleaf Dr
Your Personal Tour Guide
Ask me questions while you tour the home.