Estimated Value: $338,000 - $363,000
3
Beds
2
Baths
2,066
Sq Ft
$170/Sq Ft
Est. Value
About This Home
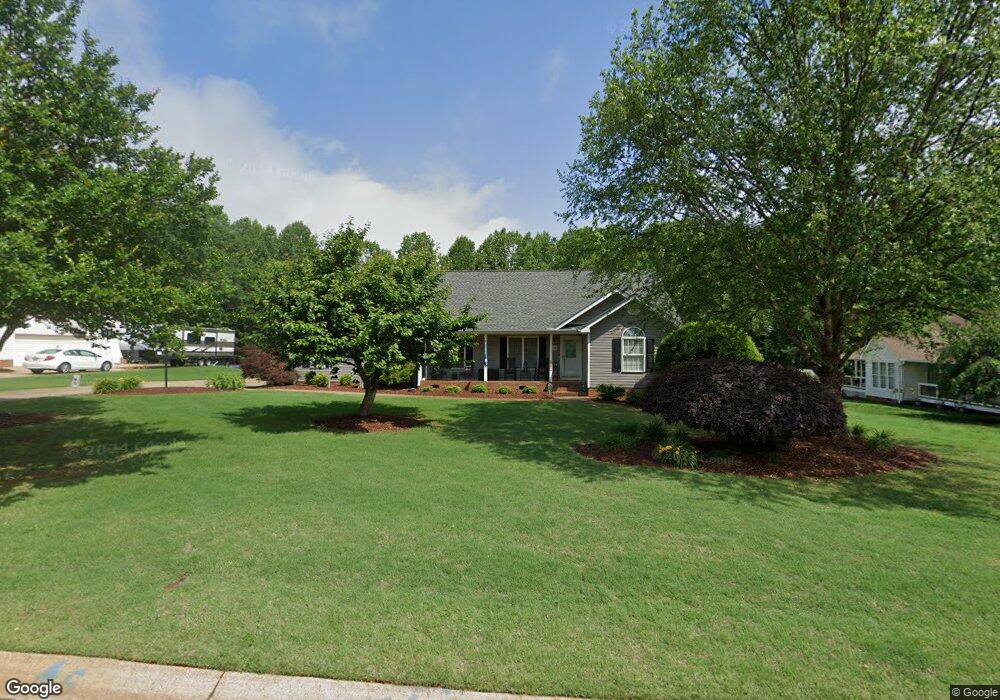
This home is located at 321 Trantham Ct, Inman, SC 29349 and is currently estimated at $350,879, approximately $169 per square foot. 321 Trantham Ct is a home located in Spartanburg County with nearby schools including Boiling Springs Middle School, Boiling Springs High School, and Spartanburg Christian Academy.
Ownership History
Date
Name
Owned For
Owner Type
Purchase Details
Closed on
Aug 23, 2016
Sold by
Blackwell Jonathan and Blackwell Colby S
Bought by
Blackwell Colby S
Current Estimated Value
Purchase Details
Closed on
Feb 25, 2015
Sold by
Jenkins James and Jenkins Heather Davis
Bought by
Blackwell Colby S and Blackwell Jonathan
Home Financials for this Owner
Home Financials are based on the most recent Mortgage that was taken out on this home.
Original Mortgage
$150,000
Interest Rate
3.77%
Mortgage Type
New Conventional
Purchase Details
Closed on
Dec 1, 2005
Sold by
Cannon James C
Bought by
Jenkins James and Jenkins Heather Davis
Purchase Details
Closed on
Apr 7, 2005
Sold by
Fleenor Carolyn P
Bought by
Cannon James C
Create a Home Valuation Report for This Property
The Home Valuation Report is an in-depth analysis detailing your home's value as well as a comparison with similar homes in the area
Home Values in the Area
Average Home Value in this Area
Purchase History
| Date | Buyer | Sale Price | Title Company |
|---|---|---|---|
| Blackwell Colby S | $1,917 | None Available | |
| Blackwell Colby S | $167,000 | -- | |
| Jenkins James | $141,500 | -- | |
| Cannon James C | $124,378 | -- |
Source: Public Records
Mortgage History
| Date | Status | Borrower | Loan Amount |
|---|---|---|---|
| Previous Owner | Blackwell Colby S | $150,000 |
Source: Public Records
Tax History
| Year | Tax Paid | Tax Assessment Tax Assessment Total Assessment is a certain percentage of the fair market value that is determined by local assessors to be the total taxable value of land and additions on the property. | Land | Improvement |
|---|---|---|---|---|
| 2022 | $1,328 | $7,682 | $837 | $6,845 |
| 2021 | $1,326 | $7,682 | $837 | $6,845 |
| 2020 | $1,307 | $7,682 | $837 | $6,845 |
| 2019 | $1,307 | $7,682 | $837 | $6,845 |
| 2018 | $1,277 | $7,682 | $837 | $6,845 |
| 2017 | $1,123 | $6,680 | $840 | $5,840 |
| 2016 | $1,130 | $6,680 | $840 | $5,840 |
| 2015 | $1,087 | $6,432 | $840 | $5,592 |
| 2014 | $1,073 | $6,432 | $840 | $5,592 |
Source: Public Records
Map
Nearby Homes
- 137 Stonehedge Dr
- 5271 S Carolina 9
- 7310 Wayside Run
- 948 Seay Rd
- 7094 Wingate Dr
- 655 Autumn Breeze Walk
- 4026 Hoskins Dr
- 4002 Hometown Way
- 948 Bryden Ln
- 4207 Winding Ridge Ln
- 3009 English Cottage Way
- 4242 Winding Ridge Ln
- 3004 English Cottage Way
- 3013 English Cottage Way
- 812 Batten Cottage Ct
- 3008 English Cottage Way
- 3017 English Cottage Way
- 813 Batten Cottage Ct
- 804 Batten Cottage Ct
- 1007 Tudor Cottage Tr
- 317 Trantham Ct
- 325 Trantham Ct
- 309 Trantham Ct
- 329 Trantham Ct
- 244 Breckenridge Dr
- 248 Breckenridge Dr
- 252 Breckenridge Dr
- 320 Trantham Ct
- 240 Breckenridge Dr
- 324 Trantham Ct
- 312 Trantham Ct
- 305 Trantham Ct
- 333 Trantham Ct
- 240 Breckenridge Dr
- 256 Breckenridge Dr
- 316 Trantham Ct
- 328 Trantham Ct
- 308 Trantham Ct
- 332 Trantham Ct
- 230 Breckenridge Dr
Your Personal Tour Guide
Ask me questions while you tour the home.