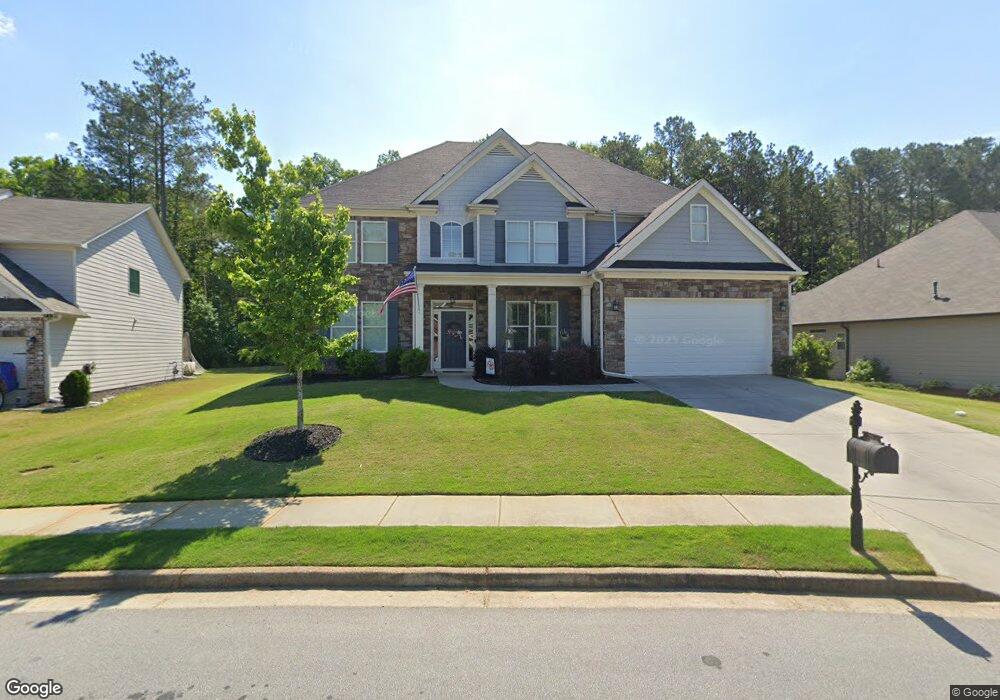
321 Turtle Rock Place Unit 386 Acworth, GA 30101
Cedarcrest NeighborhoodEstimated Value: $530,530 - $625,000
5
Beds
6
Baths
3,556
Sq Ft
$165/Sq Ft
Est. Value
About This Home
This home is located at 321 Turtle Rock Place Unit 386, Acworth, GA 30101 and is currently estimated at $588,383, approximately $165 per square foot. 321 Turtle Rock Place Unit 386 is a home located in Paulding County with nearby schools including Burnt Hickory Elementary School, Sammy Mcclure Sr. Middle School, and North Paulding High School.
Ownership History
Date
Name
Owned For
Owner Type
Purchase Details
Closed on
Oct 20, 2016
Sold by
South Georgia Custom Homes
Bought by
Sabo Lance
Current Estimated Value
Home Financials for this Owner
Home Financials are based on the most recent Mortgage that was taken out on this home.
Original Mortgage
$304,385
Outstanding Balance
$242,383
Interest Rate
3.25%
Mortgage Type
FHA
Estimated Equity
$346,000
Purchase Details
Closed on
Jun 30, 2015
Sold by
Sharp Residential Llc
Bought by
South Georgia Custom Homes Llc
Home Financials for this Owner
Home Financials are based on the most recent Mortgage that was taken out on this home.
Original Mortgage
$21,000
Interest Rate
3.92%
Mortgage Type
Commercial
Create a Home Valuation Report for This Property
The Home Valuation Report is an in-depth analysis detailing your home's value as well as a comparison with similar homes in the area
Home Values in the Area
Average Home Value in this Area
Purchase History
| Date | Buyer | Sale Price | Title Company |
|---|---|---|---|
| Sabo Lance | $310,000 | -- | |
| South Georgia Custom Homes Llc | $37,500 | -- |
Source: Public Records
Mortgage History
| Date | Status | Borrower | Loan Amount |
|---|---|---|---|
| Open | Sabo Lance | $304,385 | |
| Previous Owner | South Georgia Custom Homes Llc | $21,000 |
Source: Public Records
Tax History Compared to Growth
Tax History
| Year | Tax Paid | Tax Assessment Tax Assessment Total Assessment is a certain percentage of the fair market value that is determined by local assessors to be the total taxable value of land and additions on the property. | Land | Improvement |
|---|---|---|---|---|
| 2024 | $4,891 | $199,880 | $26,000 | $173,880 |
| 2023 | $5,047 | $196,120 | $26,000 | $170,120 |
| 2022 | $4,234 | $164,280 | $26,000 | $138,280 |
| 2021 | $4,340 | $151,200 | $26,000 | $125,200 |
| 2020 | $4,216 | $143,800 | $26,000 | $117,800 |
| 2019 | $4,059 | $136,560 | $26,000 | $110,560 |
| 2018 | $4,267 | $143,480 | $26,000 | $117,480 |
| 2017 | $3,731 | $137,440 | $20,000 | $117,440 |
| 2016 | $212 | $7,000 | $7,000 | $0 |
| 2015 | $215 | $7,000 | $7,000 | $0 |
| 2014 | $101 | $3,200 | $3,200 | $0 |
| 2013 | -- | $3,200 | $3,200 | $0 |
Source: Public Records
Map
Nearby Homes
- 1136 Flagstone Way
- 291 Harmony Cir
- 134 Grove Meadow Dr
- 148 Carlton Ct
- 62 Cleburne Place
- 262 Lilyfield Ln
- 825 Flagstone Way
- 9 Little Ct
- 26 Lilyfield Ln
- 61 Gellmore Ln
- 197 Hickory Pointe Dr
- 88 Water Oak Dr
- 283 Hickory Pointe Dr
- 140 Arthur Hills Dr
- 51 Water Oak Dr
- 138 Knightwood Point Unit 2
- 498 Remington Ln
- 47 Vine Creek Ln
- 174 Timber Creek #176 Ln SW
- 280 Graves Rd
- 321 Turtle Rock Place
- 333 Turtle Rock Place
- 309 Turtle Rock Place
- 17 Turtle Rock Cove
- 332 Turtle Rock Place
- 299 Turtle Rock Place
- 29 Turtle Rock Cove
- 294 Turtle Rock Place
- 356 Turtle Rock Place
- 26 Turtle Rock Cove
- 43 Turtle Rock Cove
- 370 Turtle Rock Place
- 238 Turtle Rock Place
- 241 Harmony Grove Church Rd
- 273 Turtle Rock Place
- 386 Turtle Rock Place
- 48 Turtle Rock Cove
- 57 Turtle Rock Cove
- 218 Turtle Rock Place
- 263 Turtle Rock Place