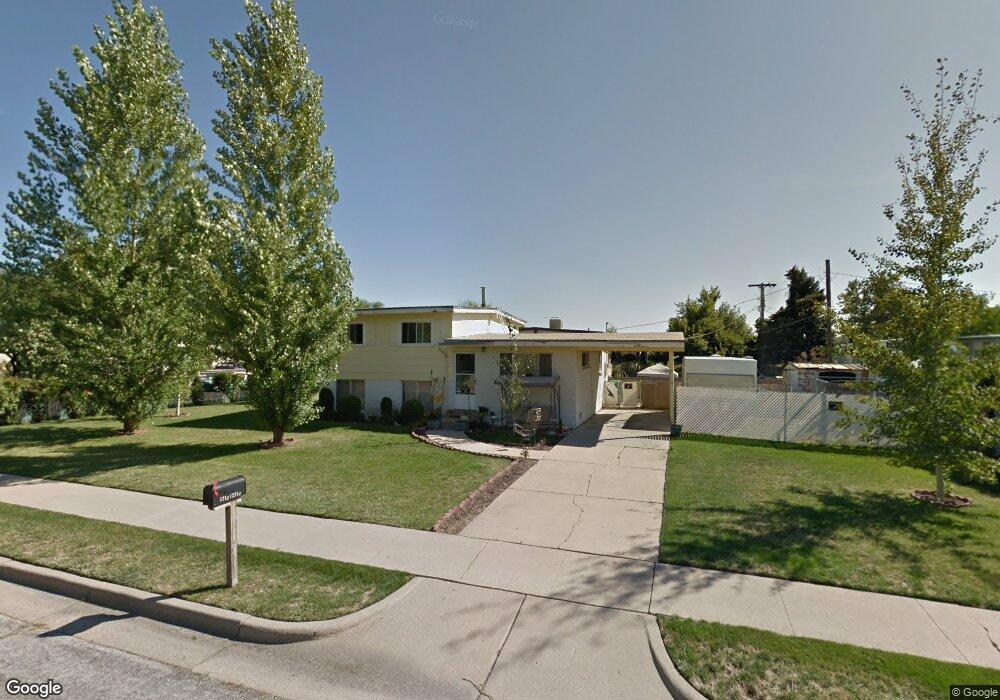
321 W 1225 N Layton, UT 84041
Estimated Value: $383,000 - $438,000
3
Beds
1
Bath
1,520
Sq Ft
$268/Sq Ft
Est. Value
About This Home
This home is located at 321 W 1225 N, Layton, UT 84041 and is currently estimated at $407,479, approximately $268 per square foot. 321 W 1225 N is a home located in Davis County with nearby schools including Crestview Elementary School, Central Davis Junior High School, and Northridge High School.
Ownership History
Date
Name
Owned For
Owner Type
Purchase Details
Closed on
Sep 14, 2018
Sold by
Stone David J and Stone Marchelle
Bought by
Stone David and Stone Marchelle
Current Estimated Value
Home Financials for this Owner
Home Financials are based on the most recent Mortgage that was taken out on this home.
Original Mortgage
$173,655
Outstanding Balance
$150,498
Interest Rate
4.5%
Mortgage Type
VA
Estimated Equity
$256,981
Purchase Details
Closed on
May 31, 2006
Sold by
Thompson Corey A and Thompson Judy G
Bought by
Stone David J and Stone Marchelle
Home Financials for this Owner
Home Financials are based on the most recent Mortgage that was taken out on this home.
Original Mortgage
$6,911
Interest Rate
6.55%
Mortgage Type
Stand Alone Second
Purchase Details
Closed on
Jun 23, 2000
Sold by
Holmes Samuel H and Lanning Russell M
Bought by
Thompson Corey A and Thompson Judy G
Home Financials for this Owner
Home Financials are based on the most recent Mortgage that was taken out on this home.
Original Mortgage
$90,256
Interest Rate
8.53%
Mortgage Type
FHA
Create a Home Valuation Report for This Property
The Home Valuation Report is an in-depth analysis detailing your home's value as well as a comparison with similar homes in the area
Home Values in the Area
Average Home Value in this Area
Purchase History
| Date | Buyer | Sale Price | Title Company |
|---|---|---|---|
| Stone David | -- | Security Title Of Davi | |
| Stone David J | -- | Backman Title Services | |
| Thompson Corey A | -- | Equity Title Agency |
Source: Public Records
Mortgage History
| Date | Status | Borrower | Loan Amount |
|---|---|---|---|
| Open | Stone David | $173,655 | |
| Closed | Stone David J | $6,911 | |
| Closed | Stone David J | $115,192 | |
| Previous Owner | Thompson Corey A | $90,256 |
Source: Public Records
Tax History Compared to Growth
Tax History
| Year | Tax Paid | Tax Assessment Tax Assessment Total Assessment is a certain percentage of the fair market value that is determined by local assessors to be the total taxable value of land and additions on the property. | Land | Improvement |
|---|---|---|---|---|
| 2025 | $1,813 | $190,300 | $95,169 | $95,131 |
| 2024 | $1,742 | $184,250 | $110,995 | $73,255 |
| 2023 | $1,722 | $321,000 | $133,677 | $187,323 |
| 2022 | $1,712 | $173,250 | $70,552 | $102,698 |
| 2021 | $1,530 | $231,000 | $98,635 | $132,365 |
| 2020 | $1,395 | $202,000 | $83,133 | $118,867 |
| 2019 | $1,403 | $199,000 | $79,084 | $119,916 |
| 2018 | $1,236 | $176,000 | $79,084 | $96,916 |
| 2016 | $1,095 | $80,410 | $25,176 | $55,234 |
| 2015 | $1,021 | $71,170 | $25,176 | $45,994 |
| 2014 | $1,016 | $72,416 | $25,176 | $47,240 |
| 2013 | -- | $65,974 | $18,612 | $47,362 |
Source: Public Records
Map
Nearby Homes