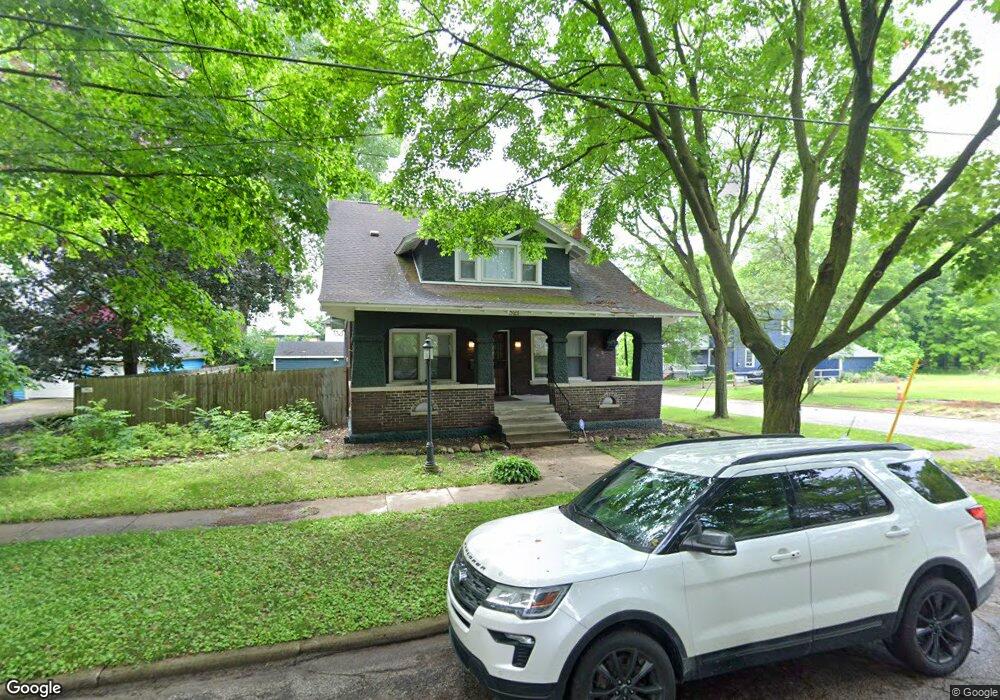
321 W 2nd Ave Flint, MI 48503
Downtown Flint NeighborhoodEstimated Value: $130,057 - $167,000
5
Beds
2
Baths
2,200
Sq Ft
$65/Sq Ft
Est. Value
About This Home
This home is located at 321 W 2nd Ave, Flint, MI 48503 and is currently estimated at $142,264, approximately $64 per square foot. 321 W 2nd Ave is a home located in Genesee County with nearby schools including Doyle/Ryder School, Flint Cultural Center Academy, and WAY Academy of Flint.
Ownership History
Date
Name
Owned For
Owner Type
Purchase Details
Closed on
May 6, 2009
Sold by
Nasser Monica D
Bought by
Lamberson Cassandra D
Current Estimated Value
Purchase Details
Closed on
Nov 30, 2006
Sold by
Jackson Alphonso R
Bought by
Lamberson Cassandra Dianne
Purchase Details
Closed on
Jul 20, 2006
Sold by
Countrywide Home Loans Inc
Bought by
Hud
Purchase Details
Closed on
Oct 12, 2005
Sold by
Mackie Karen
Bought by
Countrywide Home Loans Inc
Purchase Details
Closed on
Jun 6, 2001
Sold by
Federal National Mortgage Association
Bought by
Mickie Karen
Purchase Details
Closed on
Dec 5, 2000
Sold by
Mortgage Electronic Registration Systems
Bought by
First Chicago Nbd Mtg Company and Nbd Mtg Company
Purchase Details
Closed on
Feb 23, 2000
Sold by
Charles Edda L
Bought by
First Chicago Nbd Mtg Company
Create a Home Valuation Report for This Property
The Home Valuation Report is an in-depth analysis detailing your home's value as well as a comparison with similar homes in the area
Home Values in the Area
Average Home Value in this Area
Purchase History
| Date | Buyer | Sale Price | Title Company |
|---|---|---|---|
| Lamberson Cassandra D | $800 | None Available | |
| Lamberson Cassandra Dianne | $31,503 | Wolverton Title Research Co | |
| Hud | -- | None Available | |
| Countrywide Home Loans Inc | $97,567 | -- | |
| Mickie Karen | $57,720 | Guaranty Title Company | |
| First Chicago Nbd Mtg Company | -- | -- | |
| First Chicago Nbd Mtg Company | $48,239 | -- |
Source: Public Records
Tax History
| Year | Tax Paid | Tax Assessment Tax Assessment Total Assessment is a certain percentage of the fair market value that is determined by local assessors to be the total taxable value of land and additions on the property. | Land | Improvement |
|---|---|---|---|---|
| 2025 | $1,312 | $59,000 | $0 | $0 |
| 2024 | $1,177 | $43,300 | $0 | $0 |
| 2023 | $1,150 | $31,200 | $0 | $0 |
| 2022 | $0 | $25,500 | $0 | $0 |
| 2021 | $1,202 | $24,400 | $0 | $0 |
| 2020 | $1,073 | $22,100 | $0 | $0 |
| 2019 | $1,038 | $17,400 | $0 | $0 |
| 2018 | $1,063 | $16,300 | $0 | $0 |
| 2017 | $1,111 | $0 | $0 | $0 |
| 2016 | $1,103 | $0 | $0 | $0 |
| 2015 | -- | $0 | $0 | $0 |
| 2014 | -- | $0 | $0 | $0 |
| 2012 | -- | $24,000 | $0 | $0 |
Source: Public Records
Map
Nearby Homes
- 416 W 2nd Ave Unit 4
- 407 W 2nd Ave
- 1016 Garland St
- 1214 Root St
- 913 Davis St
- 314 E 4th St
- 211 W 5th St
- 1025 Frost St
- 410 E 4th St
- 1409 Prospect St
- 607 Thayer St
- A Avenue
- 621 Pierson St
- 1215 S Grand Traverse St
- 710 Pierson St
- 1016 Dupont St
- 1114 S Grand Traverse St
- 1606 Garland St
- 800 Martin Luther King Ave
- 1717 Wolcott St
Your Personal Tour Guide
Ask me questions while you tour the home.