321 W Shawnee St Tahlequah, OK 74464
Estimated payment $1,625/month
Highlights
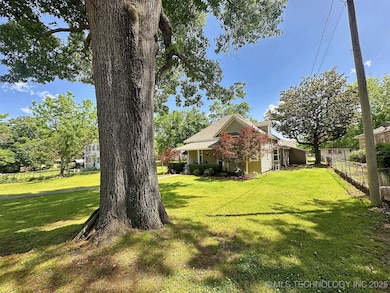
- Mature Trees
- Wood Flooring
- High Ceiling
- Tahlequah Middle School Rated A-
- Attic
- Granite Countertops
About This Home
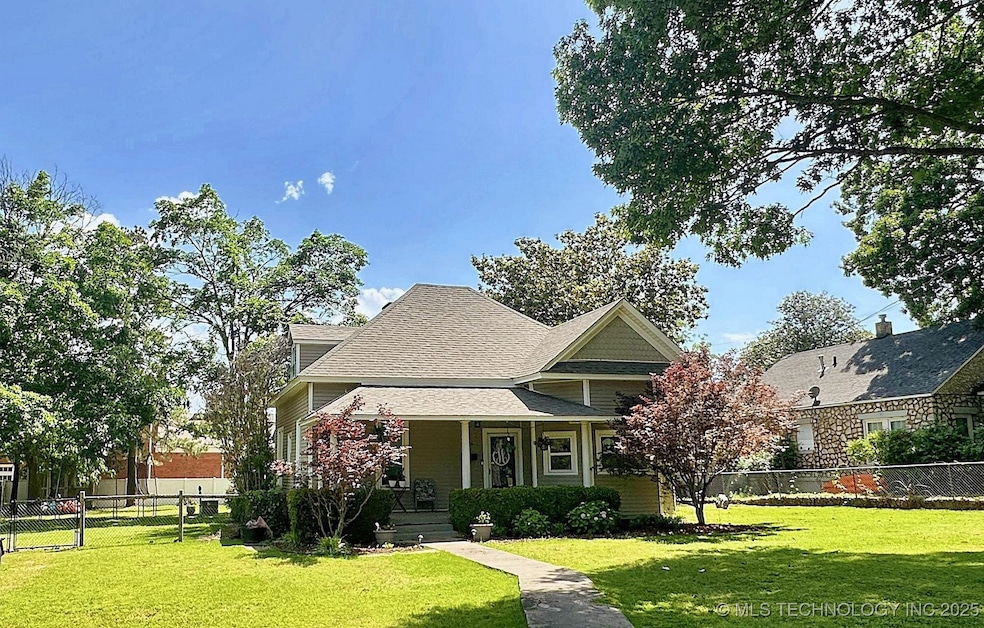
One-of-a-Kind Timeless Home in the Heart of Tahlequah
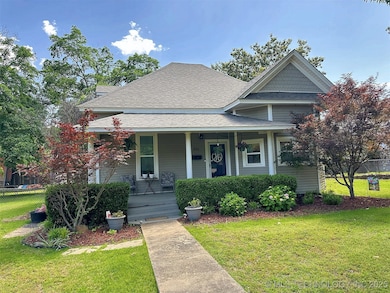
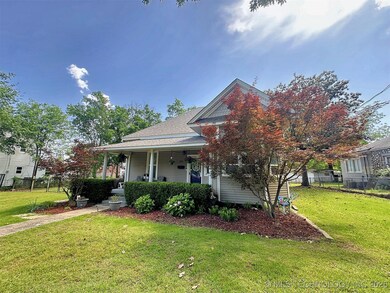
Welcome to this beautifully preserved 4-bedroom, 2.5-bath home with a 1-car garage and private alley access. Nestled among mature trees on a fenced lot, this charming residence offers a rare blend of character and comfort.
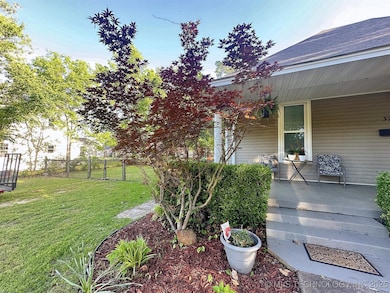
Step onto the inviting covered front porch—perfect for relaxing with a cup of coffee—and into a home where original, gorgeous hardwood floors and soaring 12-foot ceilings create a warm and elegant atmosphere.
The thoughtfully designed floor plan includes a cozy nook currently used as an office, conveniently located near the half bath and garage. The spacious living areas are ideal for both everyday living and hosting guests.
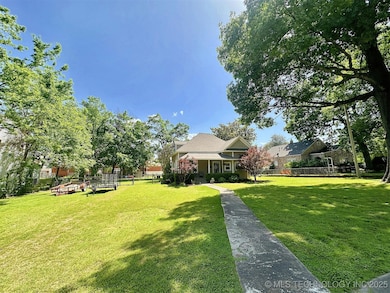
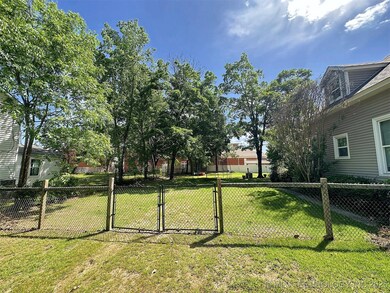
If you love to entertain, the backyard is your private oasis. Enjoy the expansive lawn and concrete patio, perfect for gatherings and outdoor dining, all while being tucked away from the front street for added privacy.
Don’t miss your chance to own this unique gem in one of Tahlequah’s most desirable neighborhoods! Owner/Agent.
Home Details
Home Type
- Single Family
Est. Annual Taxes
- $407
Year Built
- Built in 1948
Lot Details
- 0.39 Acre Lot
- North Facing Home
- Privacy Fence
- Vinyl Fence
- Chain Link Fence
- Mature Trees
- Wooded Lot
Parking
- 1 Car Attached Garage
- Gravel Driveway
Home Design
- Wood Frame Construction
- Fiberglass Roof
- Aluminum Siding
- Asphalt
Interior Spaces
- 2,216 Sq Ft Home
- 2-Story Property
- Wired For Data
- High Ceiling
- Ceiling Fan
- Vinyl Clad Windows
- Insulated Windows
- Crawl Space
- Washer and Electric Dryer Hookup
- Attic
Kitchen
- Oven
- Stove
- Range
- Microwave
- Plumbed For Ice Maker
- Dishwasher
- Granite Countertops
- Disposal
Flooring
- Wood
- Carpet
- Tile
Bedrooms and Bathrooms
- 4 Bedrooms
Home Security
- Storm Doors
- Fire and Smoke Detector
Schools
- Tahlequah Elementary School
- Tahlequah High School
Utilities
- Zoned Heating and Cooling
- Multiple Heating Units
- Heating System Uses Gas
- Electric Water Heater
- High Speed Internet
- Cable TV Available
Additional Features
- Energy-Efficient Windows
- Covered Patio or Porch
Community Details
- No Home Owners Association
- Tahlequah Lots Subdivision
Map
Home Values in the Area
Average Home Value in this Area
Tax History
| Year | Tax Paid | Tax Assessment Tax Assessment Total Assessment is a certain percentage of the fair market value that is determined by local assessors to be the total taxable value of land and additions on the property. | Land | Improvement |
|---|---|---|---|---|
| 2024 | $407 | $5,292 | $657 | $4,635 |
| 2023 | $407 | $5,138 | $628 | $4,510 |
| 2022 | $370 | $4,989 | $610 | $4,379 |
| 2021 | $358 | $4,843 | $592 | $4,251 |
| 2020 | $351 | $4,703 | $575 | $4,128 |
| 2019 | $335 | $4,565 | $1,650 | $2,915 |
| 2018 | $875 | $9,200 | $1,430 | $7,770 |
| 2017 | $953 | $10,040 | $1,350 | $8,690 |
| 2016 | $913 | $9,563 | $1,286 | $8,277 |
| 2015 | $816 | $9,107 | $1,275 | $7,832 |
| 2014 | $816 | $8,674 | $1,012 | $7,662 |
Property History
| Date | Event | Price | Change | Sq Ft Price |
|---|---|---|---|---|
| 09/24/2025 09/24/25 | Pending | -- | -- | -- |
| 07/15/2025 07/15/25 | Price Changed | $299,999 | -1.3% | $135 / Sq Ft |
| 07/08/2025 07/08/25 | Price Changed | $303,999 | -2.3% | $137 / Sq Ft |
| 07/02/2025 07/02/25 | Price Changed | $311,000 | -1.0% | $140 / Sq Ft |
| 06/16/2025 06/16/25 | Price Changed | $313,999 | -1.9% | $142 / Sq Ft |
| 06/02/2025 06/02/25 | Price Changed | $319,999 | -4.5% | $144 / Sq Ft |
| 05/16/2025 05/16/25 | For Sale | $334,999 | -- | $151 / Sq Ft |
Purchase History
| Date | Type | Sale Price | Title Company |
|---|---|---|---|
| Warranty Deed | $41,500 | Infinity Title Llc | |
| Interfamily Deed Transfer | -- | None Available | |
| Warranty Deed | $88,000 | -- | |
| Warranty Deed | $59,500 | -- |
Mortgage History
| Date | Status | Loan Amount | Loan Type |
|---|---|---|---|
| Closed | $105,120 | Construction | |
| Previous Owner | $6,249 | Purchase Money Mortgage |
Source: MLS Technology
MLS Number: 2521516
APN: 3001-00-065-001-0-001-00
Disclaimer: Certain information contained herein is derived from information provided by parties other than Homes.com. All information provided is deemed reliable, but is not guaranteed to be accurate and should be independently verified.
![]() IDX information is provided exclusively for personal, non-commercial use, and may not be used for any purpose other than to identify prospective properties consumers may be interested in purchasing.
IDX information is provided exclusively for personal, non-commercial use, and may not be used for any purpose other than to identify prospective properties consumers may be interested in purchasing.
Information is deemed reliable but not guaranteed.
- 509 W Shawnee St
- 515 W Delaware St
- 610 W Delaware St
- 525 W Downing St
- 224 W Chickasaw St
- 615 Russell Ave
- 0 W Choctaw St
- 403 S Bluff Ave
- 104 S West Ave
- 807 W Choctaw St
- 528 S Muskogee Ave
- 310 York St
- 535 S Mission Ave
- 916 Coy Ave
- 516 W Fox St
- 619 E Cherrie St
- 402 Minor St
- 201 Sandy Cir
- 709 Brentwood Dr
- 606 Goingsnake St
