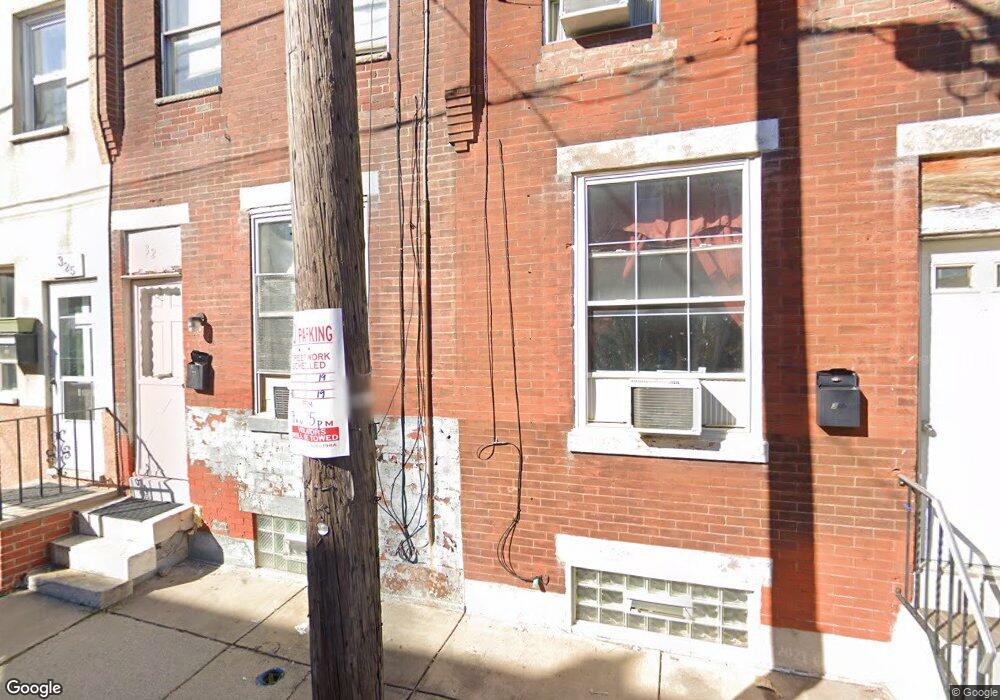
321 Winton St Philadelphia, PA 19148
Whitman NeighborhoodEstimated Value: $166,647 - $231,000
2
Beds
1
Bath
780
Sq Ft
$251/Sq Ft
Est. Value
About This Home
This home is located at 321 Winton St, Philadelphia, PA 19148 and is currently estimated at $195,662, approximately $250 per square foot. 321 Winton St is a home located in Philadelphia County with nearby schools including George W. Sharswood School, Furness Horace High School, and St. Casimir School.
Ownership History
Date
Name
Owned For
Owner Type
Purchase Details
Closed on
Oct 24, 2005
Sold by
Rowan John J
Bought by
Bearing Sinath
Current Estimated Value
Home Financials for this Owner
Home Financials are based on the most recent Mortgage that was taken out on this home.
Original Mortgage
$65,000
Outstanding Balance
$34,775
Interest Rate
5.85%
Mortgage Type
Purchase Money Mortgage
Estimated Equity
$160,887
Purchase Details
Closed on
Jun 25, 2004
Sold by
Jeffery Josephine
Bought by
Rowan John J
Create a Home Valuation Report for This Property
The Home Valuation Report is an in-depth analysis detailing your home's value as well as a comparison with similar homes in the area
Home Values in the Area
Average Home Value in this Area
Purchase History
| Date | Buyer | Sale Price | Title Company |
|---|---|---|---|
| Bearing Sinath | $65,000 | None Available | |
| Rowan John J | -- | -- |
Source: Public Records
Mortgage History
| Date | Status | Borrower | Loan Amount |
|---|---|---|---|
| Open | Bearing Sinath | $65,000 |
Source: Public Records
Tax History Compared to Growth
Tax History
| Year | Tax Paid | Tax Assessment Tax Assessment Total Assessment is a certain percentage of the fair market value that is determined by local assessors to be the total taxable value of land and additions on the property. | Land | Improvement |
|---|---|---|---|---|
| 2026 | $1,690 | $150,400 | $30,080 | $120,320 |
| 2025 | $1,690 | $150,400 | $30,080 | $120,320 |
| 2024 | $1,690 | $150,400 | $30,080 | $120,320 |
| 2023 | $1,690 | $120,700 | $24,140 | $96,560 |
| 2022 | $813 | $75,700 | $24,140 | $51,560 |
| 2021 | $1,443 | $0 | $0 | $0 |
| 2020 | $1,443 | $0 | $0 | $0 |
| 2019 | $1,333 | $0 | $0 | $0 |
| 2018 | $631 | $0 | $0 | $0 |
| 2017 | $1,051 | $0 | $0 | $0 |
| 2016 | $631 | $0 | $0 | $0 |
| 2015 | $866 | $0 | $0 | $0 |
| 2014 | -- | $94,600 | $11,123 | $83,477 |
| 2012 | -- | $8,128 | $897 | $7,231 |
Source: Public Records
Map
Nearby Homes