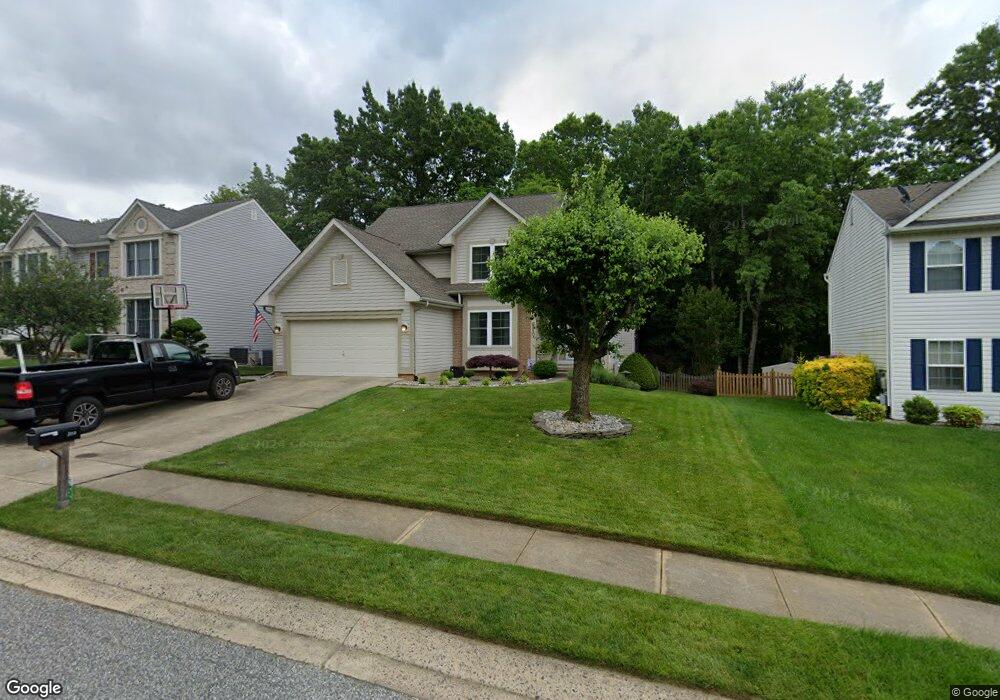
3210 Eastbend Ct Abingdon, MD 21009
Estimated Value: $459,907 - $535,000
--
Bed
3
Baths
2,012
Sq Ft
$248/Sq Ft
Est. Value
About This Home
This home is located at 3210 Eastbend Ct, Abingdon, MD 21009 and is currently estimated at $498,727, approximately $247 per square foot. 3210 Eastbend Ct is a home located in Harford County with nearby schools including Abingdon Elementary School, Edgewood Middle School, and Edgewood High School.
Ownership History
Date
Name
Owned For
Owner Type
Purchase Details
Closed on
May 4, 2005
Sold by
Bock Bryan G
Bought by
Latzo Gregory S and Latzo Julia M
Current Estimated Value
Home Financials for this Owner
Home Financials are based on the most recent Mortgage that was taken out on this home.
Original Mortgage
$299,000
Interest Rate
6.01%
Mortgage Type
Credit Line Revolving
Purchase Details
Closed on
Aug 17, 2001
Sold by
Roots Bridget D
Bought by
Bock Bryan G and Bock Katherine A
Purchase Details
Closed on
Jun 3, 1999
Sold by
Mitchell Eugene Lloyd
Bought by
Roots Bridget D
Purchase Details
Closed on
Aug 24, 1994
Sold by
Lexington Homes Inc
Bought by
Mitchell Eugene L
Home Financials for this Owner
Home Financials are based on the most recent Mortgage that was taken out on this home.
Original Mortgage
$165,050
Interest Rate
8.65%
Purchase Details
Closed on
May 9, 1994
Sold by
Vlg Bynum Run 4 Lp
Bought by
Lexington Homes Inc
Home Financials for this Owner
Home Financials are based on the most recent Mortgage that was taken out on this home.
Original Mortgage
$119,706
Interest Rate
7.7%
Create a Home Valuation Report for This Property
The Home Valuation Report is an in-depth analysis detailing your home's value as well as a comparison with similar homes in the area
Home Values in the Area
Average Home Value in this Area
Purchase History
| Date | Buyer | Sale Price | Title Company |
|---|---|---|---|
| Latzo Gregory S | $379,000 | -- | |
| Bock Bryan G | $183,500 | -- | |
| Roots Bridget D | $182,000 | -- | |
| Mitchell Eugene L | $173,776 | -- | |
| Lexington Homes Inc | $45,257 | -- |
Source: Public Records
Mortgage History
| Date | Status | Borrower | Loan Amount |
|---|---|---|---|
| Closed | Latzo Gregory S | $299,000 | |
| Closed | Latzo Gregory S | $80,000 | |
| Previous Owner | Lexington Homes Inc | $165,050 | |
| Previous Owner | Lexington Homes Inc | $119,706 | |
| Closed | Roots Bridget D | -- |
Source: Public Records
Tax History Compared to Growth
Tax History
| Year | Tax Paid | Tax Assessment Tax Assessment Total Assessment is a certain percentage of the fair market value that is determined by local assessors to be the total taxable value of land and additions on the property. | Land | Improvement |
|---|---|---|---|---|
| 2025 | $3,559 | $354,133 | $0 | $0 |
| 2024 | $3,338 | $332,267 | $0 | $0 |
| 2023 | $3,338 | $310,400 | $100,000 | $210,400 |
| 2022 | $3,338 | $306,267 | $0 | $0 |
| 2021 | $3,439 | $302,133 | $0 | $0 |
| 2020 | $3,439 | $298,000 | $100,000 | $198,000 |
| 2019 | $3,415 | $295,900 | $0 | $0 |
| 2018 | $3,360 | $293,800 | $0 | $0 |
| 2017 | $3,336 | $291,700 | $0 | $0 |
| 2016 | $140 | $291,700 | $0 | $0 |
| 2015 | $3,547 | $291,700 | $0 | $0 |
| 2014 | $3,547 | $294,900 | $0 | $0 |
Source: Public Records
Map
Nearby Homes
- 724 Hookers Mill Rd
- Kipling Plan at Laurel Oaks
- Devonshire Plan at Laurel Oaks
- Parker Plan at Laurel Oaks
- Sebastian Plan at Laurel Oaks
- Covington Plan at Laurel Oaks
- Hawthorne Plan at Laurel Oaks
- Magnolia Plan at Laurel Oaks
- Savannah Plan at Laurel Oaks
- Ethan Plan at Laurel Oaks
- Woodford Plan at Laurel Oaks
- Nottingham Plan at Laurel Oaks
- Augusta Plan at Laurel Oaks
- Arcadia Plan at Laurel Oaks
- Addison Plan at Laurel Oaks
- 3322 Racoon Ct
- 2000 Treese Unit DEVONSHIRE
- 2000 Treese Unit COVINGTON
- 2000 Treese Unit MAGNOLIA
- 2000 Treese Unit SAVANNAH
- 3208 Eastbend Ct
- 3212 Eastbend Ct
- 3206 Eastbend Ct
- 3217 Eastbend Ct
- 3214 Eastbend Ct
- 3219 Eastbend Ct
- 3216 Eastbend Ct
- 3204 Eastbend Ct
- 3202 Eastbend Ct
- 3201 Eastbend Ct
- 3221 Eastbend Ct
- 3215 Eastbend Ct
- 3218 Eastbend Ct
- 3203 Eastbend Ct
- 3223 Eastbend Ct
- 3211 Eastbend Ct
- 3209 Eastbend Ct
- 3213 Eastbend Ct
- 3056 Clarkson Dr
- 3054 Clarkson Dr