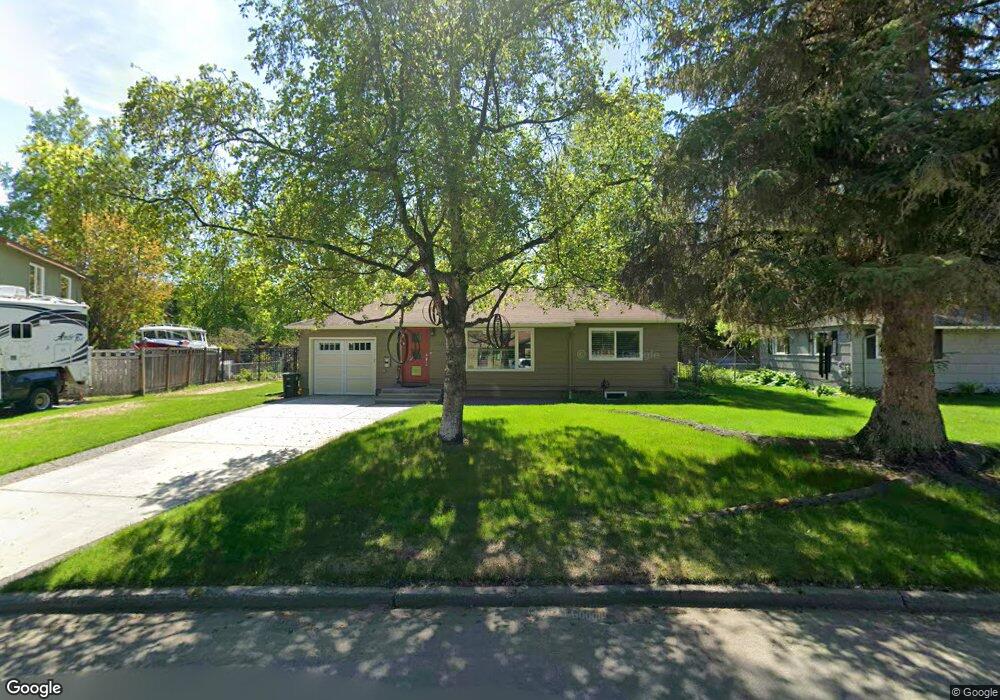
3210 Knik Ave Anchorage, AK 99517
Turnagain NeighborhoodEstimated Value: $282,000 - $593,000
3
Beds
3
Baths
2,168
Sq Ft
$222/Sq Ft
Est. Value
About This Home
This home is located at 3210 Knik Ave, Anchorage, AK 99517 and is currently estimated at $481,018, approximately $221 per square foot. 3210 Knik Ave is a home located in Anchorage Municipality with nearby schools including Turnagain Elementary School, Romig Middle School, and West High School.
Ownership History
Date
Name
Owned For
Owner Type
Purchase Details
Closed on
Apr 5, 2006
Sold by
Cummiskey Patricia A
Bought by
Coscia Valarie J
Current Estimated Value
Home Financials for this Owner
Home Financials are based on the most recent Mortgage that was taken out on this home.
Original Mortgage
$300,000
Outstanding Balance
$171,303
Interest Rate
6.25%
Mortgage Type
Fannie Mae Freddie Mac
Estimated Equity
$309,715
Purchase Details
Closed on
May 7, 1997
Sold by
Barter Paul J
Bought by
Cummiskey Patricia A
Purchase Details
Closed on
Dec 10, 1990
Sold by
State Of Alaska and Alaska Permanent Fund Corporation
Bought by
Barter Paul J
Home Financials for this Owner
Home Financials are based on the most recent Mortgage that was taken out on this home.
Original Mortgage
$125,440
Interest Rate
10.27%
Mortgage Type
FHA
Create a Home Valuation Report for This Property
The Home Valuation Report is an in-depth analysis detailing your home's value as well as a comparison with similar homes in the area
Home Values in the Area
Average Home Value in this Area
Purchase History
| Date | Buyer | Sale Price | Title Company |
|---|---|---|---|
| Coscia Valarie J | -- | None Available | |
| Cummiskey Patricia A | -- | -- | |
| Cummiskey Patricia A | -- | -- | |
| Barter Paul J | -- | -- |
Source: Public Records
Mortgage History
| Date | Status | Borrower | Loan Amount |
|---|---|---|---|
| Open | Coscia Valarie J | $300,000 | |
| Previous Owner | Barter Paul J | $125,440 | |
| Closed | Cummiskey Patricia A | $0 |
Source: Public Records
Tax History
| Year | Tax Paid | Tax Assessment Tax Assessment Total Assessment is a certain percentage of the fair market value that is determined by local assessors to be the total taxable value of land and additions on the property. | Land | Improvement |
|---|---|---|---|---|
| 2025 | $6,506 | $504,100 | $227,700 | $276,400 |
| 2024 | $6,506 | $478,000 | $213,500 | $264,500 |
| 2023 | $7,648 | $449,100 | $213,500 | $235,600 |
| 2022 | $6,746 | $450,600 | $213,500 | $237,100 |
| 2021 | $7,374 | $409,200 | $213,500 | $195,700 |
| 2020 | $6,176 | $413,600 | $213,500 | $200,100 |
| 2019 | $5,836 | $406,700 | $213,500 | $193,200 |
| 2018 | $5,783 | $402,600 | $213,500 | $189,100 |
| 2017 | $6,201 | $416,000 | $213,500 | $202,500 |
| 2016 | $5,428 | $425,700 | $207,200 | $218,500 |
| 2015 | $5,428 | $423,400 | $202,300 | $221,100 |
| 2014 | $5,428 | $391,500 | $202,300 | $189,200 |
Source: Public Records
Map
Nearby Homes
- 2921 W 29th Ave Unit 5B
- 2906 W 29th Ave
- 2540 Lord Baranof Dr
- 2401 W Marston Dr
- 2335 Lord Baranof Dr
- 2934 Marston Dr
- 2543 La Honda Dr Unit 7
- 000 Chilligan Dr
- 4111 Woronzof Dr
- 3517 Vintage Cir
- 3171 Horizon St
- 3240 Wiley Post Loop
- 2140 Atwood Dr
- Tr A W Northern Lights Blvd
- 2511 Abbey Ln
- 2064 Belair Dr
- 2201 Belmont Dr
- 1936 Wildwood Ln
- 4000 Iowa Dr
- 3409 Oregon Dr
- 3220 Knik Ave
- 3200 Knik Ave
- 3321 Seppala Dr
- 3232 Knik Ave
- 3134 Knik Ave
- 3201 Knik Ave
- 3327 Seppala Dr
- 3135 Knik Ave
- 3242 Knik Ave
- 3221 Knik Ave
- 3120 Knik Ave
- 3231 Knik Ave
- 3121 Knik Ave
- 3339 Seppala Dr
- 3300 Knik Ave
- 2565 Foraker Dr
- 3243 W Northern Lights Blvd
- 3322 Seppala Dr
- 2700 Turnagain Pkwy
- 2716 Turnagain Pkwy
Your Personal Tour Guide
Ask me questions while you tour the home.