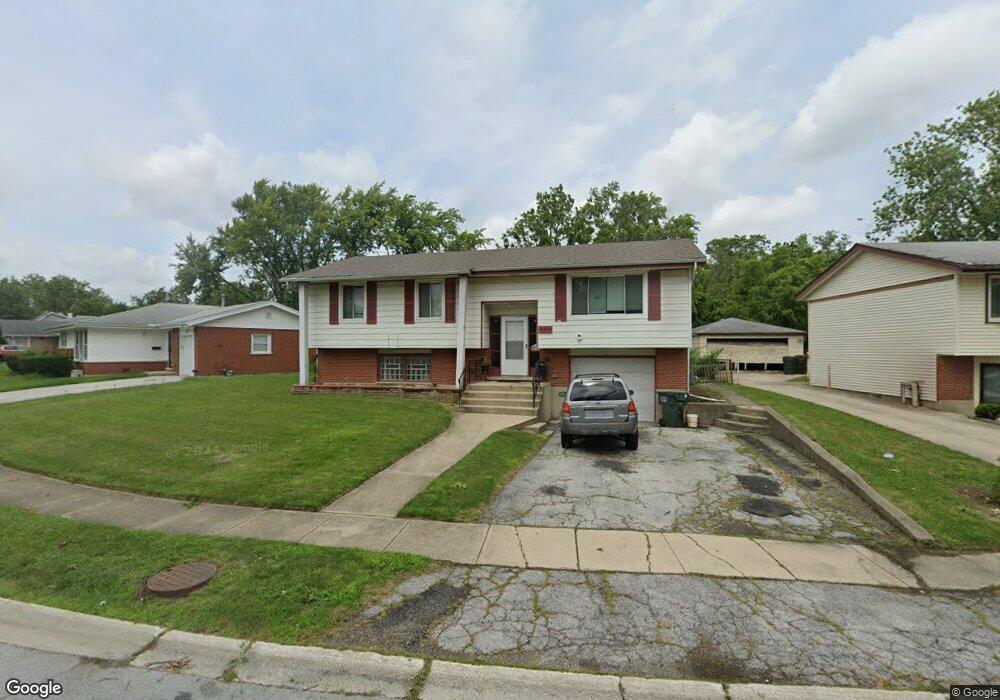
3210 Maple Ln Hazel Crest, IL 60429
Estimated Value: $170,000 - $213,000
3
Beds
1
Bath
1,056
Sq Ft
$186/Sq Ft
Est. Value
About This Home
This home is located at 3210 Maple Ln, Hazel Crest, IL 60429 and is currently estimated at $196,517, approximately $186 per square foot. 3210 Maple Ln is a home located in Cook County with nearby schools including Highlands Elementary School, Prairie-Hills Junior High School, and Hillcrest High School.
Ownership History
Date
Name
Owned For
Owner Type
Purchase Details
Closed on
Jun 30, 2017
Sold by
Secretary Of Hud
Bought by
Vpp Holdings Llc
Current Estimated Value
Home Financials for this Owner
Home Financials are based on the most recent Mortgage that was taken out on this home.
Original Mortgage
$10,000
Outstanding Balance
$8,221
Interest Rate
3.95%
Mortgage Type
Commercial
Estimated Equity
$188,296
Purchase Details
Closed on
Jul 23, 2015
Sold by
Bank Of America N A
Bought by
Secretary Of Housing And Urban Developme
Purchase Details
Closed on
Jun 2, 2015
Sold by
Neely Ketina
Bought by
Bank Of America Na
Purchase Details
Closed on
Feb 24, 2003
Sold by
Rollins Robert G and Rollins Linda A
Bought by
Neely Ketina
Home Financials for this Owner
Home Financials are based on the most recent Mortgage that was taken out on this home.
Original Mortgage
$108,199
Interest Rate
5.96%
Mortgage Type
FHA
Create a Home Valuation Report for This Property
The Home Valuation Report is an in-depth analysis detailing your home's value as well as a comparison with similar homes in the area
Home Values in the Area
Average Home Value in this Area
Purchase History
| Date | Buyer | Sale Price | Title Company |
|---|---|---|---|
| Vpp Holdings Llc | -- | Greater Metropolitan Title L | |
| Secretary Of Housing And Urban Developme | -- | None Available | |
| Bank Of America Na | -- | None Available | |
| Neely Ketina | -- | 1St American Title |
Source: Public Records
Mortgage History
| Date | Status | Borrower | Loan Amount |
|---|---|---|---|
| Open | Vpp Holdings Llc | $10,000 | |
| Previous Owner | Neely Ketina | $108,199 |
Source: Public Records
Tax History
| Year | Tax Paid | Tax Assessment Tax Assessment Total Assessment is a certain percentage of the fair market value that is determined by local assessors to be the total taxable value of land and additions on the property. | Land | Improvement |
|---|---|---|---|---|
| 2025 | $7,684 | $14,016 | $2,462 | $11,554 |
| 2024 | $7,684 | $14,016 | $2,462 | $11,554 |
| 2023 | $5,165 | $15,000 | $2,462 | $12,538 |
| 2022 | $5,165 | $7,036 | $2,083 | $4,953 |
| 2021 | $5,980 | $8,451 | $2,083 | $6,368 |
| 2020 | $5,677 | $8,451 | $2,083 | $6,368 |
| 2019 | $4,449 | $6,645 | $1,893 | $4,752 |
| 2018 | $4,312 | $6,645 | $1,893 | $4,752 |
| 2017 | $3,242 | $8,724 | $1,893 | $6,831 |
| 2016 | $2,913 | $7,480 | $1,704 | $5,776 |
| 2015 | $2,720 | $7,480 | $1,704 | $5,776 |
| 2014 | $2,683 | $7,480 | $1,704 | $5,776 |
| 2013 | -- | $6,921 | $1,704 | $5,217 |
Source: Public Records
Map
Nearby Homes
- 3312 Maple Ln
- 3213 Woodworth Place
- 3319 Tulip Dr
- 17113 Elm Dr
- 3321 Tulip Dr
- 3318 Tulip Dr
- 17306 Burr Oak Ln
- 17007 Elm Dr
- 3321 173rd St
- 17206 Elm Dr
- 3311 Hickory Ln
- 3214 Birchwood Dr
- 3107 173rd St
- 17005 Albany Ave Unit 102
- 3012 171st St Unit GT
- 3511 Laurel Ln
- 17006 Novak Dr Unit T107
- 3316 Birchwood Dr
- 3100 Longfellow Ave
- 17417 Kedzie Ave
Your Personal Tour Guide
Ask me questions while you tour the home.