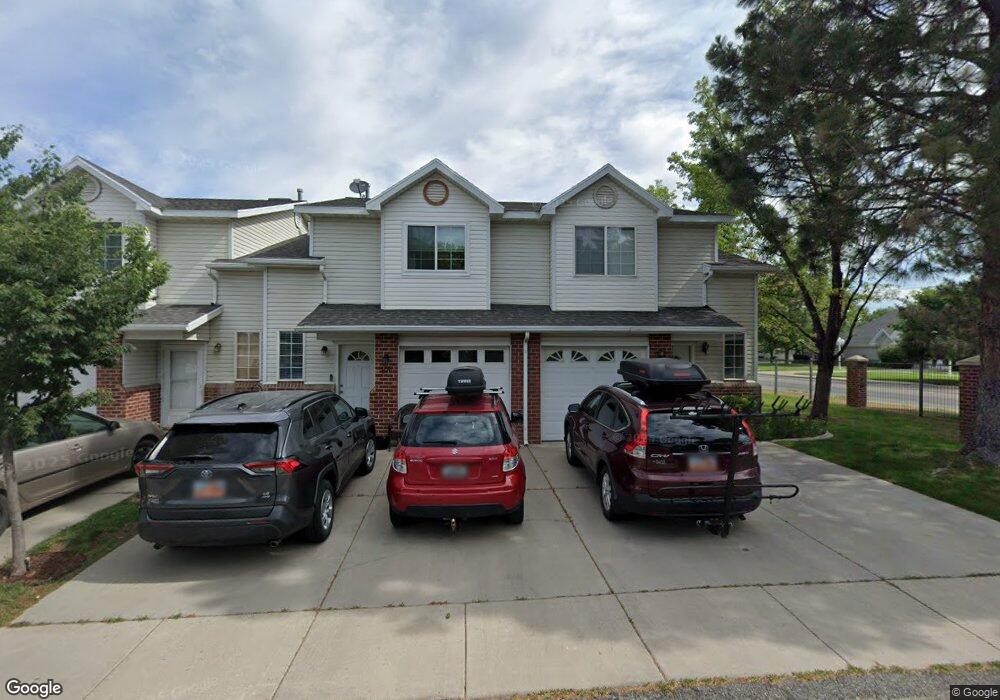
3210 Monterey Pine Ln Unit 11B West Jordan, UT 84088
Edenbrooke NeighborhoodEstimated Value: $343,000 - $371,366
3
Beds
3
Baths
1,091
Sq Ft
$328/Sq Ft
Est. Value
About This Home
This home is located at 3210 Monterey Pine Ln Unit 11B, West Jordan, UT 84088 and is currently estimated at $358,342, approximately $328 per square foot. 3210 Monterey Pine Ln Unit 11B is a home located in Salt Lake County with nearby schools including Westvale Elementary School, Joel P. Jensen Middle School, and West Jordan High School.
Ownership History
Date
Name
Owned For
Owner Type
Purchase Details
Closed on
Jul 30, 2019
Sold by
Demars Stuaert Kent
Bought by
Johnson Emily Brooke
Current Estimated Value
Home Financials for this Owner
Home Financials are based on the most recent Mortgage that was taken out on this home.
Original Mortgage
$200,000
Outstanding Balance
$175,593
Interest Rate
3.82%
Mortgage Type
New Conventional
Estimated Equity
$182,749
Purchase Details
Closed on
Sep 21, 2011
Sold by
Federal Home Loan Mortgage Corporation
Bought by
Demars Stuart Kent
Home Financials for this Owner
Home Financials are based on the most recent Mortgage that was taken out on this home.
Original Mortgage
$69,675
Interest Rate
4.09%
Mortgage Type
New Conventional
Purchase Details
Closed on
Jun 3, 2011
Sold by
Hardy John D and Hardy John H
Bought by
Federal Home Loan Mortgage Corp
Purchase Details
Closed on
Nov 26, 2007
Sold by
Andersen John Curtis and Andersen Jennifer L
Bought by
Hardy John D and Hardy John H
Home Financials for this Owner
Home Financials are based on the most recent Mortgage that was taken out on this home.
Original Mortgage
$162,925
Interest Rate
6.3%
Mortgage Type
Purchase Money Mortgage
Purchase Details
Closed on
Jan 18, 2005
Sold by
Royce Rory
Bought by
Andersen John Curtis and Soglio Jemmifer Lyn Dal
Home Financials for this Owner
Home Financials are based on the most recent Mortgage that was taken out on this home.
Original Mortgage
$111,550
Interest Rate
5.69%
Mortgage Type
FHA
Purchase Details
Closed on
Dec 5, 2003
Sold by
Hud
Bought by
Royce Rory
Home Financials for this Owner
Home Financials are based on the most recent Mortgage that was taken out on this home.
Original Mortgage
$93,588
Interest Rate
6.04%
Mortgage Type
FHA
Purchase Details
Closed on
Sep 10, 2003
Sold by
Citimortgage Inc
Bought by
Hud
Purchase Details
Closed on
Aug 5, 2003
Sold by
Henkel Evelyn K
Bought by
Citimortgage Inc
Purchase Details
Closed on
Mar 5, 1998
Sold by
Michel Kimi L
Bought by
Henkel Evelyn K
Home Financials for this Owner
Home Financials are based on the most recent Mortgage that was taken out on this home.
Original Mortgage
$103,750
Interest Rate
6.99%
Mortgage Type
FHA
Purchase Details
Closed on
Sep 27, 1996
Sold by
Jordan Pines Townhomes L C
Bought by
Michel Kimi L
Home Financials for this Owner
Home Financials are based on the most recent Mortgage that was taken out on this home.
Original Mortgage
$95,000
Interest Rate
7.95%
Create a Home Valuation Report for This Property
The Home Valuation Report is an in-depth analysis detailing your home's value as well as a comparison with similar homes in the area
Home Values in the Area
Average Home Value in this Area
Purchase History
| Date | Buyer | Sale Price | Title Company |
|---|---|---|---|
| Johnson Emily Brooke | -- | Title Guarantee | |
| Demars Stuart Kent | -- | Bonneville Superior Title | |
| Federal Home Loan Mortgage Corp | $115,000 | Etitle Insurance Agency | |
| Hardy John D | -- | None Available | |
| Andersen John Curtis | -- | Meridian Title | |
| Royce Rory | -- | Us Title Of Utah | |
| Hud | -- | Backman Stewart Title Svcs | |
| Citimortgage Inc | $110,065 | Backman Stewart Title Svcs | |
| Henkel Evelyn K | -- | -- | |
| Michel Kimi L | -- | -- |
Source: Public Records
Mortgage History
| Date | Status | Borrower | Loan Amount |
|---|---|---|---|
| Open | Johnson Emily Brooke | $200,000 | |
| Previous Owner | Demars Stuart Kent | $69,675 | |
| Previous Owner | Hardy John D | $162,925 | |
| Previous Owner | Andersen John Curtis | $111,550 | |
| Previous Owner | Royce Rory | $93,588 | |
| Previous Owner | Henkel Evelyn K | $103,750 | |
| Previous Owner | Michel Kimi L | $95,000 |
Source: Public Records
Tax History Compared to Growth
Tax History
| Year | Tax Paid | Tax Assessment Tax Assessment Total Assessment is a certain percentage of the fair market value that is determined by local assessors to be the total taxable value of land and additions on the property. | Land | Improvement |
|---|---|---|---|---|
| 2025 | $1,678 | $330,700 | $99,200 | $231,500 |
| 2024 | $1,678 | $322,800 | $96,800 | $226,000 |
| 2023 | $1,758 | $318,700 | $95,600 | $223,100 |
| 2022 | $1,806 | $322,100 | $96,600 | $225,500 |
| 2021 | $1,409 | $228,800 | $68,600 | $160,200 |
| 2020 | $1,444 | $220,100 | $66,000 | $154,100 |
| 2019 | $1,305 | $195,000 | $58,500 | $136,500 |
| 2018 | $1,197 | $177,400 | $53,200 | $124,200 |
| 2017 | $1,104 | $163,000 | $48,900 | $114,100 |
| 2016 | $1,032 | $143,100 | $42,900 | $100,200 |
| 2015 | $1,007 | $136,100 | $40,800 | $95,300 |
| 2014 | $1,013 | $134,800 | $40,400 | $94,400 |
Source: Public Records
Map
Nearby Homes
- 3214 W Monterey Pine Ln
- 2970 W 8870 S
- 8886 S 2700 W
- 8493 S 3200 W
- 2883 Jana Lee Dr
- 4000 W 8400 S Unit 83
- 3112 Green Acre Dr
- 8407 Meadow Green Way
- 2636 W 9110 S
- 8461 S Meadowlark Ln
- 9294 S 2700 W
- 9178 Lisa Ave
- 8983 S 3860 W
- 3750 W Bingham Creek Dr
- 3256 Star Fire Rd
- 1967 W 9350 S
- 3827 W Country Squire Dr
- 3888 W 8700 S
- 8180 S Old Bingham Hwy
- 3931 W Dansere Cir
- 3210 W Monterey Pine Ln
- 3204 W Monterey Pine Ln
- 3204 Monterey Pine Ln
- 3234 W Monterey Pine Ln
- 3214 Monterey Pine Ln
- 3224 W Monterey Pine Ln
- 3224 Monterey Pine Ln
- 3211 W Brynwood S
- 3211 W Brynwood Pine Bay
- 3211 Brynwood Pine Bay
- 3219 W Brynwood Pine Bay
- 3205 W Brynwood Pine Bay
- 3205 Brynwood Pine Bay
- 3226 W Monterey Pine Ln
- 3226 Monterey Pine Ln
- 3219 Brynwood Pine Bay
- 3225 Brynwood Pine Bay
- 3222 Monterey Pine Ln
- 3231 Brynwood Pine Bay
- 3231 W Brynwood Pine Bay