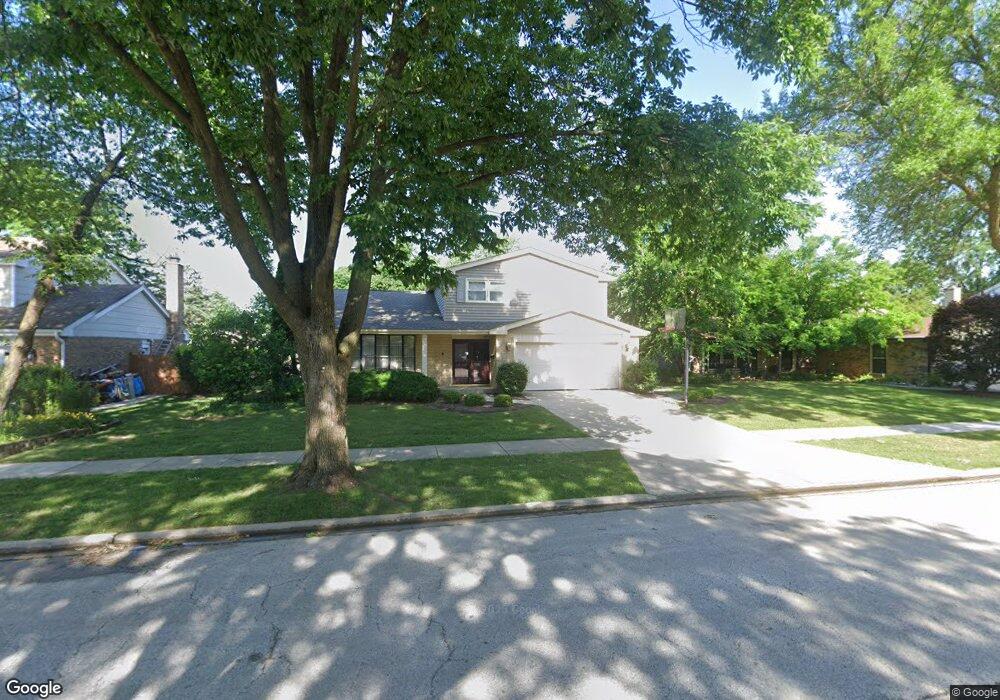
3210 N Walker Ln W Arlington Heights, IL 60004
Estimated Value: $485,000 - $595,000
3
Beds
3
Baths
1,609
Sq Ft
$346/Sq Ft
Est. Value
About This Home
This home is located at 3210 N Walker Ln W, Arlington Heights, IL 60004 and is currently estimated at $557,225, approximately $346 per square foot. 3210 N Walker Ln W is a home located in Cook County with nearby schools including J.W. Riley Elementary School, Jack London Middle School, and Buffalo Grove High School.
Ownership History
Date
Name
Owned For
Owner Type
Purchase Details
Closed on
Nov 1, 2024
Sold by
Fuller Jessica C and Fuller-Doran Jessica
Bought by
Jessica C Fuller 2024 Living Trust and Fuller
Current Estimated Value
Purchase Details
Closed on
Jun 11, 2021
Sold by
Doran Patrick J and Fuller Doran Jessica
Bought by
Fuller Doran Jessica
Purchase Details
Closed on
Sep 5, 2008
Sold by
Burhop Jeffrey S and Burhop Shaunna R
Bought by
Doran Patrick J and Fuller Doran Jessica
Home Financials for this Owner
Home Financials are based on the most recent Mortgage that was taken out on this home.
Original Mortgage
$348,800
Interest Rate
6.55%
Mortgage Type
Unknown
Purchase Details
Closed on
Feb 14, 1996
Sold by
Brandel Richard A and Brandel Elizabeth L
Bought by
Burhop Jeffry S and Burhop Shaunna R
Home Financials for this Owner
Home Financials are based on the most recent Mortgage that was taken out on this home.
Original Mortgage
$200,000
Interest Rate
7.16%
Create a Home Valuation Report for This Property
The Home Valuation Report is an in-depth analysis detailing your home's value as well as a comparison with similar homes in the area
Home Values in the Area
Average Home Value in this Area
Purchase History
| Date | Buyer | Sale Price | Title Company |
|---|---|---|---|
| Jessica C Fuller 2024 Living Trust | -- | None Listed On Document | |
| Fuller Doran Jessica | -- | Accommodation | |
| Doran Patrick J | $436,000 | Baird & Warner Title Service | |
| Burhop Jeffry S | $250,000 | Attorneys Title Guaranty Fun |
Source: Public Records
Mortgage History
| Date | Status | Borrower | Loan Amount |
|---|---|---|---|
| Previous Owner | Doran Patrick J | $348,800 | |
| Previous Owner | Burhop Jeffry S | $200,000 |
Source: Public Records
Tax History Compared to Growth
Tax History
| Year | Tax Paid | Tax Assessment Tax Assessment Total Assessment is a certain percentage of the fair market value that is determined by local assessors to be the total taxable value of land and additions on the property. | Land | Improvement |
|---|---|---|---|---|
| 2024 | $11,810 | $41,001 | $9,818 | $31,183 |
| 2023 | $11,224 | $41,001 | $9,818 | $31,183 |
| 2022 | $11,224 | $41,001 | $9,818 | $31,183 |
| 2021 | $10,261 | $32,991 | $5,578 | $27,413 |
| 2020 | $10,064 | $32,991 | $5,578 | $27,413 |
| 2019 | $10,162 | $36,780 | $5,578 | $31,202 |
| 2018 | $10,862 | $35,372 | $4,908 | $30,464 |
| 2017 | $10,682 | $35,372 | $4,908 | $30,464 |
| 2016 | $10,263 | $35,372 | $4,908 | $30,464 |
| 2015 | $10,020 | $32,149 | $4,239 | $27,910 |
| 2014 | $9,892 | $32,149 | $4,239 | $27,910 |
| 2013 | $9,178 | $32,149 | $4,239 | $27,910 |
Source: Public Records
Map
Nearby Homes
- 561 Park View Terrace Unit 153
- 3300 N Carriageway Dr Unit 317
- 3157 N Daniels Ct Unit 1502
- 1306 E Best Dr
- 3451 N Carriageway Dr Unit 503
- 3400 N Buffalo Grove Rd
- 3401 N Ellen Dr
- 1127 Miller Ln Unit 107
- 1225 Radcliffe Rd Unit 2
- 972 Thornton Ln Unit 102
- 1115 Miller Ln Unit 104
- 665 Thornwood Dr
- 820 Weidner Rd Unit 4013
- 820 Weidner Rd Unit 409
- 3222 N Heritage Ln
- 12 Oak Creek Dr Unit 2212
- 3227 N Heritage Ln
- 18 E Heritage Ct
- 1602 Chippewa Trail Unit 21201
- 2640 N Windsor Dr Unit 102
- 3216 N Walker Ln W
- 3206 N Walker Ln W
- 3209 N Volz Dr W
- 3215 N Volz Dr W
- 3203 N Volz Dr W
- 3220 N Walker Ln W
- 3134 N Walker Ln W
- 3219 N Volz Dr W
- 3209 N Walker Ln W
- 3215 N Walker Ln W
- 3205 N Walker Ln W
- 3135 N Volz Dr W Unit 3
- 3224 N Walker Ln W
- 3223 N Volz Dr W
- 3137 N Walker Ln W
- 3127 N Volz Dr W
- 3127 N Volz Dr W
- 3133 N Walker Ln W
- 3210 N Volz Dr W
- 3208 N Walker Ln E