Estimated Value: $347,000 - $390,000
5
Beds
3
Baths
1,692
Sq Ft
$218/Sq Ft
Est. Value
About This Home
This home is located at 3210 Rosewood Blvd, Knox, IN 46534 and is currently estimated at $368,372, approximately $217 per square foot. 3210 Rosewood Blvd is a home located in Starke County with nearby schools including Culver Elementary School and Culver Community Middle/High School.
Ownership History
Date
Name
Owned For
Owner Type
Purchase Details
Closed on
Jun 21, 2024
Sold by
Hobbs Bryan Thomas
Bought by
Hogan Michael and Hogan Natalie
Current Estimated Value
Purchase Details
Closed on
Jul 20, 2022
Sold by
Risner Justin C
Bought by
Hobbs Bryan Thomas
Home Financials for this Owner
Home Financials are based on the most recent Mortgage that was taken out on this home.
Original Mortgage
$248,000
Interest Rate
5.23%
Mortgage Type
New Conventional
Purchase Details
Closed on
Dec 20, 2006
Sold by
Clark Chandra M
Bought by
Risner Justin C
Home Financials for this Owner
Home Financials are based on the most recent Mortgage that was taken out on this home.
Original Mortgage
$129,000
Interest Rate
6.87%
Mortgage Type
Adjustable Rate Mortgage/ARM
Purchase Details
Closed on
Aug 23, 2006
Sold by
Case Allan P and Clarke Chandra M
Bought by
Charke Chandra A
Create a Home Valuation Report for This Property
The Home Valuation Report is an in-depth analysis detailing your home's value as well as a comparison with similar homes in the area
Home Values in the Area
Average Home Value in this Area
Purchase History
| Date | Buyer | Sale Price | Title Company |
|---|---|---|---|
| Hogan Michael | $357,000 | Chicago Title | |
| Hobbs Bryan Thomas | -- | None Listed On Document | |
| Risner Justin C | -- | None Available | |
| Charke Chandra A | -- | None Available |
Source: Public Records
Mortgage History
| Date | Status | Borrower | Loan Amount |
|---|---|---|---|
| Previous Owner | Hobbs Bryan Thomas | $248,000 | |
| Previous Owner | Risner Justin C | $129,000 |
Source: Public Records
Tax History Compared to Growth
Tax History
| Year | Tax Paid | Tax Assessment Tax Assessment Total Assessment is a certain percentage of the fair market value that is determined by local assessors to be the total taxable value of land and additions on the property. | Land | Improvement |
|---|---|---|---|---|
| 2024 | $1,846 | $305,400 | $23,000 | $282,400 |
| 2023 | $1,557 | $268,700 | $20,900 | $247,800 |
| 2022 | $1,036 | $179,700 | $20,300 | $159,400 |
| 2021 | $888 | $155,600 | $20,300 | $135,300 |
| 2020 | $803 | $142,200 | $20,300 | $121,900 |
| 2019 | $739 | $133,300 | $20,300 | $113,000 |
| 2018 | $728 | $132,000 | $20,300 | $111,700 |
| 2017 | $610 | $131,500 | $20,300 | $111,200 |
| 2016 | $605 | $132,400 | $20,300 | $112,100 |
| 2014 | $471 | $126,300 | $21,700 | $104,600 |
| 2013 | $431 | $126,800 | $21,700 | $105,100 |
Source: Public Records
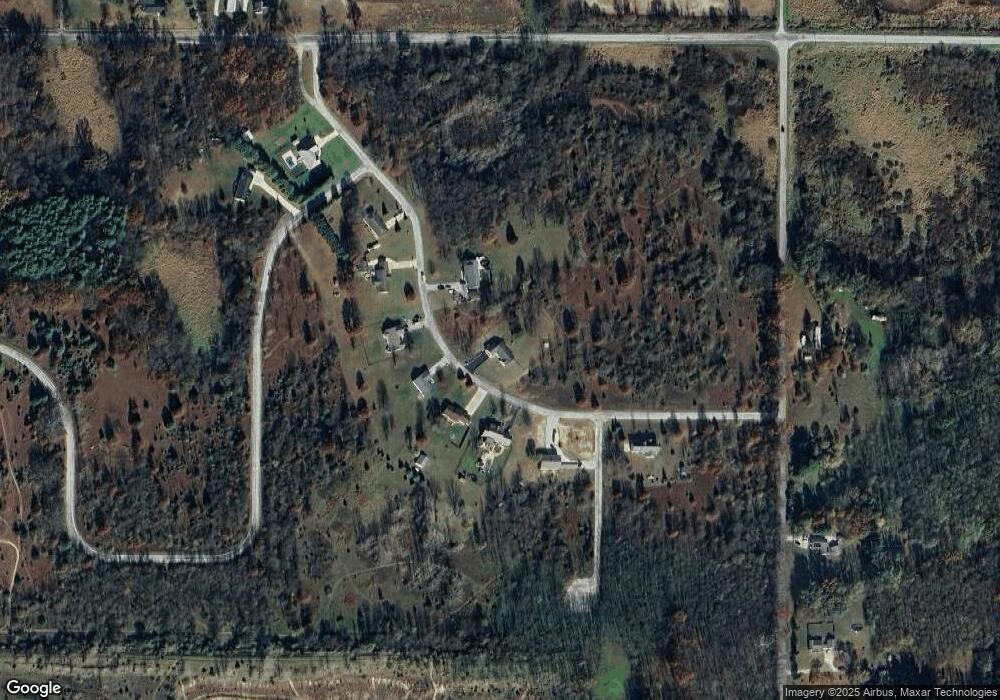
Map
Nearby Homes
- TBD F Wild Rose Dr
- TBD G Wild Rose Dr
- TBD D Wild Rose Dr
- TBD H Wild Rose Dr
- TBD C Wild Rose Dr
- TBD E Wild Rose Dr
- TBD I Wild Rose Dr
- TBD Fox Crossing
- 0 Fox Crossing Unit NRA822621
- - Fox Crossing
- 6978 Fox Crossing
- 6830 Homette Ave
- 3455 S 800 E
- 0-Rear Toto Rd
- 3767 S East Dr
- 9.08 Acres S North Dr & East of Woodland Rd E
- 3872 S Hillcrest Rd
- 3701 S 625 E
- 3835 S Hillcrest Rd
- Lot 7 N Shore Dr Unit 7
- 3210 S Rosewood Blvd
- 3160 Rosewood Blvd
- 3215 Rosewood Blvd
- 3235 Rosewood Blvd
- 3195 Rosewood Blvd
- 0-- Rosewood Blvd
- - Rosewood Blvd
- 52 Rosewood Blvd
- 54 Rosewood Blvd
- 53 Rosewood Blvd
- 18 Rosewood Blvd
- 20 Rosewood Blvd
- 55 Rosewood Blvd
- 30 Rosewood Blvd
- Lot 52 Rosewood Blvd
- Lot 23 Rosewood Blvd
- Lot 53 Rosewood Blvd
- Lot 54 Rosewood Blvd
- Lot 20 Rosewood Blvd
- Lot 56 Rosewood Blvd