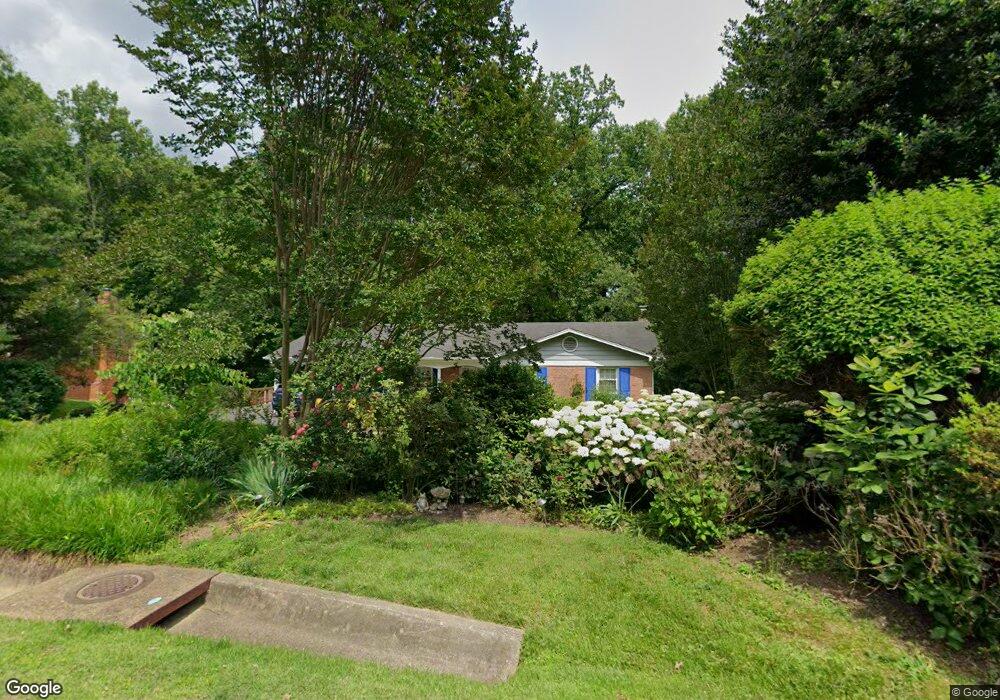
3211 Amberley Ln Fairfax, VA 22031
Estimated Value: $959,000 - $1,100,000
5
Beds
4
Baths
1,566
Sq Ft
$645/Sq Ft
Est. Value
About This Home
This home is located at 3211 Amberley Ln, Fairfax, VA 22031 and is currently estimated at $1,010,286, approximately $645 per square foot. 3211 Amberley Ln is a home located in Fairfax County with nearby schools including Mantua Elementary School, Frost Middle School, and W. T. Woodson High School.
Ownership History
Date
Name
Owned For
Owner Type
Purchase Details
Closed on
Mar 23, 2021
Sold by
Ischinger Carol N and Martin M Ischinger Trust
Bought by
Carol N Ischinger Trust and Ischinger
Current Estimated Value
Create a Home Valuation Report for This Property
The Home Valuation Report is an in-depth analysis detailing your home's value as well as a comparison with similar homes in the area
Home Values in the Area
Average Home Value in this Area
Purchase History
| Date | Buyer | Sale Price | Title Company |
|---|---|---|---|
| Carol N Ischinger Trust | -- | None Listed On Document | |
| Ischinger Carol N | -- | None Available |
Source: Public Records
Tax History Compared to Growth
Tax History
| Year | Tax Paid | Tax Assessment Tax Assessment Total Assessment is a certain percentage of the fair market value that is determined by local assessors to be the total taxable value of land and additions on the property. | Land | Improvement |
|---|---|---|---|---|
| 2025 | $58 | $888,240 | $447,000 | $441,240 |
| 2024 | $58 | $814,370 | $402,000 | $412,370 |
| 2023 | $68 | $793,510 | $397,000 | $396,510 |
| 2022 | $57 | $738,260 | $357,000 | $381,260 |
| 2021 | $59 | $714,480 | $337,000 | $377,480 |
| 2020 | $8,352 | $705,740 | $332,000 | $373,740 |
| 2019 | $8,234 | $695,740 | $322,000 | $373,740 |
| 2018 | $7,771 | $675,740 | $302,000 | $373,740 |
| 2017 | $7,586 | $653,410 | $287,000 | $366,410 |
| 2016 | $7,431 | $641,410 | $275,000 | $366,410 |
| 2015 | $7,028 | $629,780 | $267,000 | $362,780 |
| 2014 | $6,822 | $612,670 | $257,000 | $355,670 |
Source: Public Records
Map
Nearby Homes
- 3134 Prosperity Ave
- 3187 Readsborough Ct
- 3123 Pebble Hill Ln
- 9091 Bear Branch Place
- 9110 Glenbrook Rd
- 3170 Colchester Brook Ln
- 2964 Kildare Ln
- 8908 Lynnhurst Dr
- 3408 Barkley Dr
- 8803 Lynnhurst Dr
- 3371 Breckenridge Ct
- 2919 Fairhill Rd
- 3503 Alba Place
- 3331 Webley Ct
- 3314 Woodburn Village Dr Unit 13
- 3322 Woodburn Village Dr Unit 13
- 9005 Southwick St
- 3334 Woodburn Village Dr Unit 31
- 3530 Morningside Dr
- 2992 Covington St
- 3209 Amberley Ln
- 3213 Amberley Ln
- 3203 Amberley Ln
- 3207 Amberley Ln
- 3215 Amberley Ln
- 3212 Amberley Ln
- 3206 Amberley Ln
- 3214 Amberley Ln
- 3217 Amberley Ln
- 3202 Amberley Ln
- 3216 Amberley Ln
- 3205 Amberley Ln
- 3219 Amberley Ln
- 3133 Chichester Ln
- 3218 Amberley Ln
- 3131 Chichester Ln
- 3201 Chichester Ln
- 3129 Chichester Ln
- 3129 Chichester Ln Unit 3
- 3221 Amberley Ln