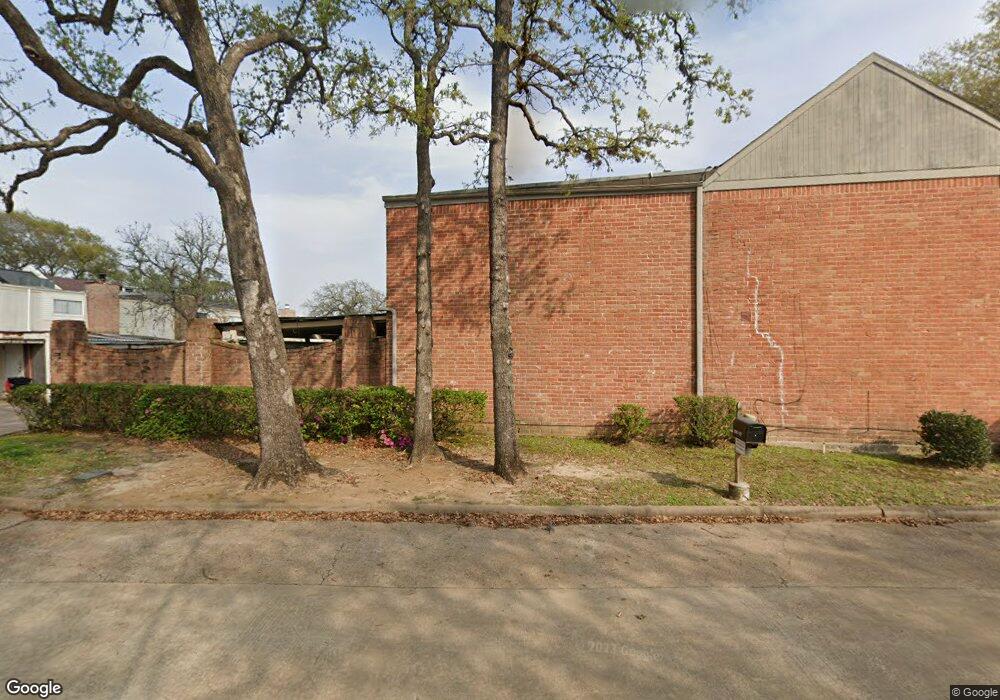
3211 Briar Ct Unit 2 Baytown, TX 77521
Estimated Value: $168,000 - $197,000
4
Beds
3
Baths
2,460
Sq Ft
$75/Sq Ft
Est. Value
About This Home
This home is located at 3211 Briar Ct Unit 2, Baytown, TX 77521 and is currently estimated at $185,505, approximately $75 per square foot. 3211 Briar Ct Unit 2 is a home located in Harris County with nearby schools including Carver Elementary School, Baytown Junior High School, and Lee High School.
Ownership History
Date
Name
Owned For
Owner Type
Purchase Details
Closed on
Jul 10, 2019
Sold by
Ksl Development Llc
Bought by
Herrera Leslie Thompson
Current Estimated Value
Home Financials for this Owner
Home Financials are based on the most recent Mortgage that was taken out on this home.
Original Mortgage
$127,645
Outstanding Balance
$112,012
Interest Rate
3.9%
Mortgage Type
FHA
Estimated Equity
$73,493
Purchase Details
Closed on
Jul 7, 2017
Sold by
Quest Ira Inc
Bought by
Ksl Development Llc
Home Financials for this Owner
Home Financials are based on the most recent Mortgage that was taken out on this home.
Original Mortgage
$102,000
Interest Rate
3.94%
Mortgage Type
Purchase Money Mortgage
Purchase Details
Closed on
Jun 16, 2017
Sold by
Brashear Morgan M
Bought by
Quest Ira Inc
Home Financials for this Owner
Home Financials are based on the most recent Mortgage that was taken out on this home.
Original Mortgage
$102,000
Interest Rate
3.94%
Mortgage Type
Purchase Money Mortgage
Purchase Details
Closed on
Oct 31, 2001
Sold by
Davidson John W and Davidson Edna O
Bought by
Brashear Morgan M
Home Financials for this Owner
Home Financials are based on the most recent Mortgage that was taken out on this home.
Original Mortgage
$67,200
Interest Rate
6.77%
Create a Home Valuation Report for This Property
The Home Valuation Report is an in-depth analysis detailing your home's value as well as a comparison with similar homes in the area
Home Values in the Area
Average Home Value in this Area
Purchase History
| Date | Buyer | Sale Price | Title Company |
|---|---|---|---|
| Herrera Leslie Thompson | -- | North Star Title | |
| Ksl Development Llc | -- | None Available | |
| Quest Ira Inc | -- | None Available | |
| Brashear Morgan M | -- | -- |
Source: Public Records
Mortgage History
| Date | Status | Borrower | Loan Amount |
|---|---|---|---|
| Open | Herrera Leslie Thompson | $127,645 | |
| Previous Owner | Ksl Development Llc | $102,000 | |
| Previous Owner | Brashear Morgan M | $67,200 | |
| Closed | Brashear Morgan M | $8,400 |
Source: Public Records
Tax History Compared to Growth
Tax History
| Year | Tax Paid | Tax Assessment Tax Assessment Total Assessment is a certain percentage of the fair market value that is determined by local assessors to be the total taxable value of land and additions on the property. | Land | Improvement |
|---|---|---|---|---|
| 2025 | $2,940 | $192,178 | $26,152 | $166,026 |
| 2024 | $2,940 | $185,024 | $26,152 | $158,872 |
| 2023 | $2,940 | $196,185 | $26,152 | $170,033 |
| 2022 | $4,550 | $174,982 | $26,152 | $148,830 |
| 2021 | $4,408 | $148,413 | $26,152 | $122,261 |
| 2020 | $4,414 | $146,982 | $23,939 | $123,043 |
| 2019 | $3,033 | $96,913 | $19,916 | $76,997 |
| 2018 | $1,661 | $66,590 | $15,088 | $51,502 |
| 2017 | $2,087 | $66,590 | $15,088 | $51,502 |
| 2016 | $1,957 | $62,447 | $6,035 | $56,412 |
| 2015 | $1,719 | $62,447 | $6,035 | $56,412 |
| 2014 | $1,719 | $54,556 | $6,035 | $48,521 |
Source: Public Records
Map
Nearby Homes
- 3206 Briar Ct Unit 1
- 4725 Indian Trail Unit 3
- 4713 Indian Trail Unit 4
- 4711 Indian Trail Unit 4
- 4809 Forest Ct
- 4912 Goose Creek Dr
- The Jackson Plan at Goose Creek Village - Jessup
- Resolution 3K Plan at Goose Creek Village - Clayton
- Colossal Plan at Goose Creek Village - Clayton
- Crazy Eights Plan at Goose Creek Village - Clayton
- 3907 Hawaiian Ct
- 3923 Hawaiian Ct
- 3914 Hawaiian Ct
- 3930 Hawaiian Ct
- 4914 Goose Creek Dr
- 5017 Glenhaven Dr
- 3951 Country Club Dr
- 5018 Glenhaven Dr
- 0 Decker Dr
- 4046 Country Club Dr
- 3211 1/2 Briar Ct Unit 2
- 3209 Briar Ct Unit 2
- 3207 Briar Ct Unit 2
- 3205 Briar Ct Unit 2
- 3203 Briar Ct Unit 2
- 3210 Briar Ct
- 3201 Briar Ct Unit 2
- 3208 Briar Ct
- 3206 Briar Ct
- 3204 Briar Ct Unit 1
- 3202 Briar Ct Unit 1
- 3200 Briar Ct Unit 1
- 4717 Indian Trail Unit 4
- 4715 Indian Trail Unit 4
- 4719 Indian Trail Unit 4
- 4723 Indian Trail Unit 3
- 4709 Indian Trail Unit 4
- 4721 Indian Trail Unit 3
- 3208 Indian Trail Unit 6
- 4707 Indian Trail Unit 5