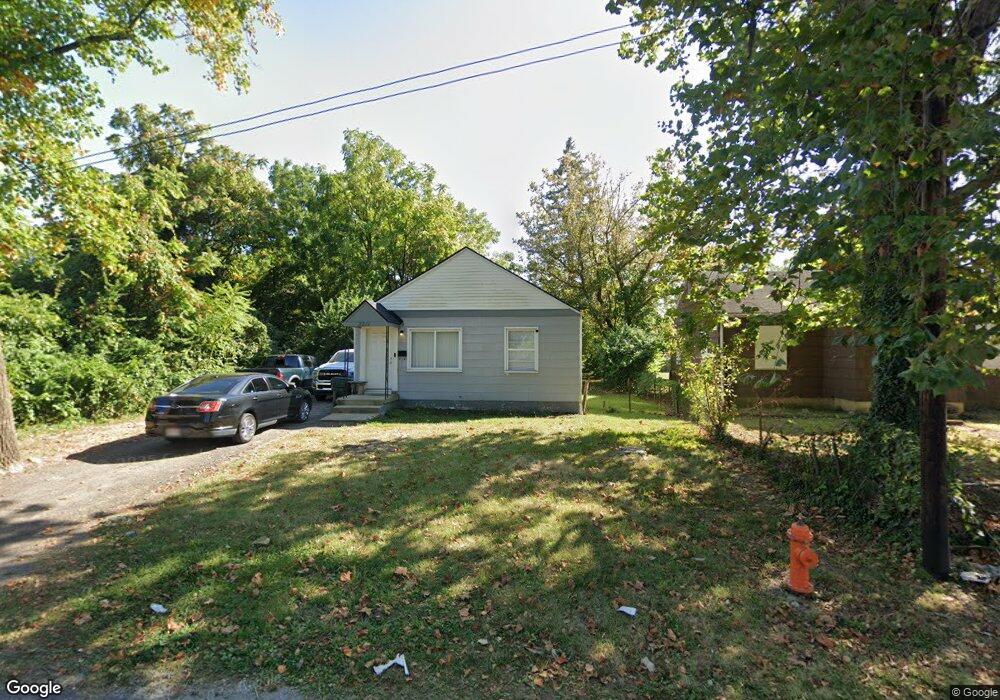
3211 E 6th Ave Columbus, OH 43219
Estimated Value: $78,000 - $127,000
2
Beds
1
Bath
672
Sq Ft
$159/Sq Ft
Est. Value
About This Home
This home is located at 3211 E 6th Ave, Columbus, OH 43219 and is currently estimated at $107,117, approximately $159 per square foot. 3211 E 6th Ave is a home located in Franklin County with nearby schools including East Columbus Elementary School, Champion Middle School, and East High School.
Ownership History
Date
Name
Owned For
Owner Type
Purchase Details
Closed on
Jun 23, 2010
Sold by
The First Citizens National Bank
Bought by
Daniels R Michell
Current Estimated Value
Purchase Details
Closed on
Mar 16, 2010
Sold by
Reber Thomas A and Cover Gayle K
Bought by
First Citizens National Bank
Purchase Details
Closed on
Aug 21, 2001
Sold by
Clark John D
Bought by
Reber Thomas A and Cover Gayle K
Home Financials for this Owner
Home Financials are based on the most recent Mortgage that was taken out on this home.
Original Mortgage
$28,800
Interest Rate
7.5%
Purchase Details
Closed on
Sep 30, 1999
Sold by
Lewis Ruby A
Bought by
Clark John D
Home Financials for this Owner
Home Financials are based on the most recent Mortgage that was taken out on this home.
Original Mortgage
$27,000
Interest Rate
7.93%
Purchase Details
Closed on
Jul 24, 1979
Bought by
Lewis Ruby A
Create a Home Valuation Report for This Property
The Home Valuation Report is an in-depth analysis detailing your home's value as well as a comparison with similar homes in the area
Home Values in the Area
Average Home Value in this Area
Purchase History
| Date | Buyer | Sale Price | Title Company |
|---|---|---|---|
| Daniels R Michell | $24,000 | Great Ameri | |
| First Citizens National Bank | $24,000 | Attorney | |
| Reber Thomas A | $33,500 | Preferred Title Agency Inc | |
| Clark John D | $33,900 | Connor Title Co | |
| Lewis Ruby A | -- | -- |
Source: Public Records
Mortgage History
| Date | Status | Borrower | Loan Amount |
|---|---|---|---|
| Previous Owner | Reber Thomas A | $28,800 | |
| Previous Owner | Clark John D | $27,000 |
Source: Public Records
Tax History
| Year | Tax Paid | Tax Assessment Tax Assessment Total Assessment is a certain percentage of the fair market value that is determined by local assessors to be the total taxable value of land and additions on the property. | Land | Improvement |
|---|---|---|---|---|
| 2025 | $1,548 | $33,780 | $10,010 | $23,770 |
| 2024 | $1,548 | $33,780 | $10,010 | $23,770 |
| 2023 | $1,529 | $33,780 | $10,010 | $23,770 |
| 2022 | $596 | $11,210 | $1,790 | $9,420 |
| 2021 | $673 | $11,210 | $1,790 | $9,420 |
| 2020 | $821 | $11,210 | $1,790 | $9,420 |
| 2019 | $640 | $10,300 | $1,650 | $8,650 |
| 2018 | $637 | $10,300 | $1,650 | $8,650 |
| 2017 | $694 | $10,300 | $1,650 | $8,650 |
| 2016 | $697 | $10,260 | $2,030 | $8,230 |
| 2015 | $635 | $10,260 | $2,030 | $8,230 |
| 2014 | $636 | $10,260 | $2,030 | $8,230 |
| 2013 | $368 | $12,040 | $2,380 | $9,660 |
Source: Public Records
Map
Nearby Homes
- 755 Stelzer Rd Unit 54
- 00 E 7th Ave
- 3014 E 7th Ave
- 0 E 7th Ave Unit Lot 79 225013171
- 0 E 7th Ave Unit Lot 77 225013170
- 0 E 7th Ave Unit Lot 78 225013168
- 2974 E 7th Ave
- 3237 E 12th Ave
- 3123 E 13th Ave
- 2969 E 11th Ave
- 0 E 5th Ave Unit 226008473
- 3001 E 12th Ave
- 2827 E 6th Ave
- 2798 E 5th Ave
- 261 Lowell Rd
- 2864 E 10th Ave
- 243 N James Rd
- 253 N James Rd
- 177 N James Rd
- 2841 E 10th Ave
Your Personal Tour Guide
Ask me questions while you tour the home.