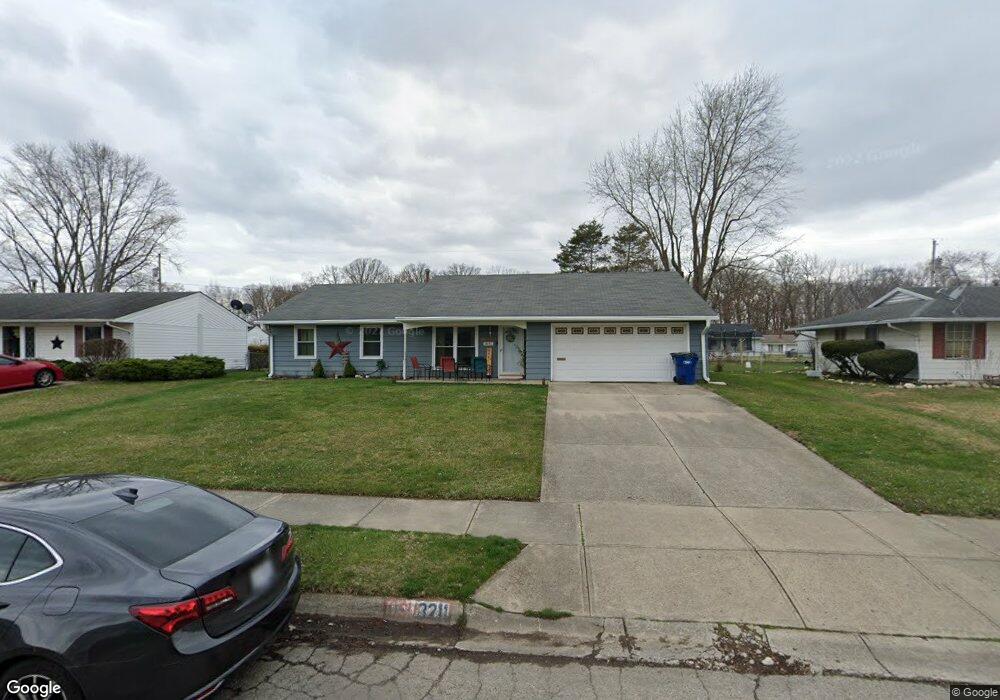
3211 Glouster St Springfield, OH 45503
Estimated Value: $189,649 - $213,000
3
Beds
2
Baths
1,296
Sq Ft
$156/Sq Ft
Est. Value
About This Home
This home is located at 3211 Glouster St, Springfield, OH 45503 and is currently estimated at $202,412, approximately $156 per square foot. 3211 Glouster St is a home located in Clark County with nearby schools including Kenton Elementary School, Roosevelt Middle School, and Springfield High School.
Ownership History
Date
Name
Owned For
Owner Type
Purchase Details
Closed on
Mar 31, 2015
Sold by
Hill Dallas L and Hill Courtney J
Bought by
Frederick Gregory A and Frederick Nancy J
Current Estimated Value
Home Financials for this Owner
Home Financials are based on the most recent Mortgage that was taken out on this home.
Original Mortgage
$96,126
Outstanding Balance
$73,973
Interest Rate
3.73%
Mortgage Type
FHA
Estimated Equity
$128,439
Purchase Details
Closed on
Apr 17, 2009
Sold by
Snyder Delores J and Miller Melena S
Bought by
Hill Dallas L and Hill Courtney J
Home Financials for this Owner
Home Financials are based on the most recent Mortgage that was taken out on this home.
Original Mortgage
$97,883
Interest Rate
5.19%
Mortgage Type
FHA
Purchase Details
Closed on
Oct 6, 2006
Sold by
Snyder Delores J and Snider Delores J
Bought by
Snyder Delores J and Miller Melena S
Create a Home Valuation Report for This Property
The Home Valuation Report is an in-depth analysis detailing your home's value as well as a comparison with similar homes in the area
Home Values in the Area
Average Home Value in this Area
Purchase History
| Date | Buyer | Sale Price | Title Company |
|---|---|---|---|
| Frederick Gregory A | $97,900 | Team Title & Closing Svcs Ll | |
| Hill Dallas L | $100,000 | Attorney | |
| Snyder Delores J | -- | Ohio Real Estate Title |
Source: Public Records
Mortgage History
| Date | Status | Borrower | Loan Amount |
|---|---|---|---|
| Open | Frederick Gregory A | $96,126 | |
| Previous Owner | Hill Dallas L | $97,883 |
Source: Public Records
Tax History Compared to Growth
Tax History
| Year | Tax Paid | Tax Assessment Tax Assessment Total Assessment is a certain percentage of the fair market value that is determined by local assessors to be the total taxable value of land and additions on the property. | Land | Improvement |
|---|---|---|---|---|
| 2024 | $1,868 | $38,760 | $9,020 | $29,740 |
| 2023 | $1,868 | $38,760 | $9,020 | $29,740 |
| 2022 | $1,913 | $38,760 | $9,020 | $29,740 |
| 2021 | $1,723 | $32,220 | $6,780 | $25,440 |
| 2020 | $1,727 | $32,220 | $6,780 | $25,440 |
| 2019 | $1,731 | $32,220 | $6,780 | $25,440 |
| 2018 | $1,661 | $29,700 | $7,190 | $22,510 |
| 2017 | $1,660 | $30,979 | $7,186 | $23,793 |
| 2016 | $1,662 | $30,979 | $7,186 | $23,793 |
| 2015 | $1,448 | $30,573 | $6,780 | $23,793 |
| 2014 | $1,442 | $30,573 | $6,780 | $23,793 |
| 2013 | $1,427 | $30,573 | $6,780 | $23,793 |
Source: Public Records
Map
Nearby Homes
- 3129 Haverhill St
- 1732 Falmouth Ave
- 3307 Tackett St
- 1939 Providence Ave
- 2907 Mystic Ln
- 3214 Revels St
- 1506 Hyannis Dr
- 3231 Vineyard St
- 2022 Westboro Ave
- 1225 Vester Ave
- 3032 Armsgate Rd Unit 25
- 1811 Devon Dr
- 3316 Sudbury St
- 3046 Brixton Dr W Unit 173
- 1148 Foxboro Rd
- 2933 Bahia Dr
- 1920 Wedgewood Cir
- 1922 Wedgewood Cir
- 1438 Ronald Rd
- 2683 Home Orchard Dr
- 3207 Glouster St
- 3206 Woonsocket St
- 3200 Woonsocket St
- 3214 Woonsocket St
- 3223 Glouster St
- 3153 Glouster St
- 3208 Glouster St
- 3216 Glouster St
- 3222 Woonsocket St
- 3156 Woonsocket St
- 3231 Glouster St
- 3145 Glouster St
- 3224 Glouster St
- 3154 Glouster St
- 3230 Woonsocket St
- 3148 Woonsocket St
- 3146 Glouster St
- 3211 Haverhill St
- 3239 Glouster St
- 3137 Glouster St