3211 NW 42nd St Oklahoma City, OK 73112
Mayfair West NeighborhoodEstimated Value: $153,961 - $170,000
2
Beds
1
Bath
1,106
Sq Ft
$147/Sq Ft
Est. Value
About This Home
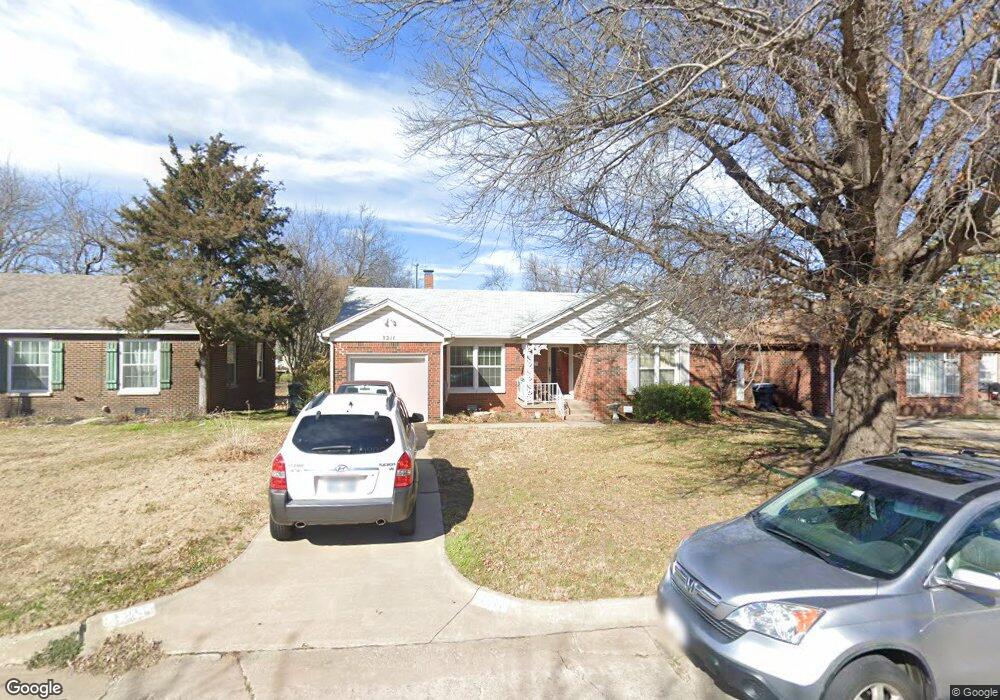
This home is located at 3211 NW 42nd St, Oklahoma City, OK 73112 and is currently estimated at $162,740, approximately $147 per square foot. 3211 NW 42nd St is a home located in Oklahoma County with nearby schools including John Marshall Enterprise Middle School, John Marshall Enterprise High School, and Independence Charter Middle School.
Ownership History
Date
Name
Owned For
Owner Type
Purchase Details
Closed on
Nov 3, 2011
Sold by
Secretary Of Housing & Urban Development
Bought by
Bradford Perianne
Current Estimated Value
Home Financials for this Owner
Home Financials are based on the most recent Mortgage that was taken out on this home.
Original Mortgage
$63,327
Outstanding Balance
$43,308
Interest Rate
4.08%
Mortgage Type
FHA
Estimated Equity
$119,432
Purchase Details
Closed on
Mar 22, 2011
Sold by
Russell Cheryl and Wells Fargo Bank N A
Bought by
Secretary Of Housing & Urban Development
Purchase Details
Closed on
Sep 11, 2008
Sold by
Calaway Ila
Bought by
Russell Cheryl
Home Financials for this Owner
Home Financials are based on the most recent Mortgage that was taken out on this home.
Original Mortgage
$88,609
Interest Rate
6.57%
Mortgage Type
FHA
Create a Home Valuation Report for This Property
The Home Valuation Report is an in-depth analysis detailing your home's value as well as a comparison with similar homes in the area
Home Values in the Area
Average Home Value in this Area
Purchase History
| Date | Buyer | Sale Price | Title Company |
|---|---|---|---|
| Bradford Perianne | -- | Hearland Title & Closing Llc | |
| Secretary Of Housing & Urban Development | -- | First American Title | |
| Russell Cheryl | $90,000 | Stewart Abstract & Title Of |
Source: Public Records
Mortgage History
| Date | Status | Borrower | Loan Amount |
|---|---|---|---|
| Open | Bradford Perianne | $63,327 | |
| Previous Owner | Russell Cheryl | $88,609 |
Source: Public Records
Tax History Compared to Growth
Tax History
| Year | Tax Paid | Tax Assessment Tax Assessment Total Assessment is a certain percentage of the fair market value that is determined by local assessors to be the total taxable value of land and additions on the property. | Land | Improvement |
|---|---|---|---|---|
| 2024 | $1,237 | $12,436 | $2,715 | $9,721 |
| 2023 | $1,237 | $12,074 | $2,132 | $9,942 |
| 2022 | $1,144 | $11,722 | $2,356 | $9,366 |
| 2021 | $1,104 | $11,381 | $2,667 | $8,714 |
| 2020 | $1,078 | $11,050 | $2,779 | $8,271 |
| 2019 | $1,039 | $10,728 | $2,197 | $8,531 |
| 2018 | $955 | $10,416 | $0 | $0 |
| 2017 | $920 | $10,112 | $2,220 | $7,892 |
| 2016 | $887 | $9,817 | $2,272 | $7,545 |
| 2015 | $862 | $9,532 | $1,980 | $7,552 |
| 2014 | $944 | $9,294 | $1,980 | $7,314 |
Source: Public Records
Map
Nearby Homes
- 3108 NW 43rd St
- 3237 NW 40th St
- 3304 NW 44th St
- 3312 NW 41st St
- 3119 NW 39th Terrace
- 3413 NW 43rd St
- 3136 NW 47th St
- 3247 NW 47th St
- 3500 Treadwell Dr
- 2912 NW 46th St
- 3535 NW 41st St
- 3528 NW 42nd St
- 3726 N Drexel Blvd
- 2832 NW 45th St
- 4313 N Saint Clair Ave
- 4305 N Saint Clair Ave
- 2824 NW 43rd St
- 2821 NW 43rd St
- 4700 N Mayfair Dr
- 2813 NW 43rd St
- 3205 NW 42nd St
- 3215 NW 42nd St
- 3219 NW 42nd St
- 3201 NW 42nd St
- 3208 NW 43rd St
- 3204 NW 43rd St
- 3212 NW 43rd St
- 3200 NW 43rd St
- 3223 NW 42nd St
- 3155 NW 42nd St
- 3210 NW 42nd St
- 3214 NW 42nd St
- 3204 NW 42nd St
- 3216 NW 43rd St
- 3140 NW 43rd St
- 3200 NW 42nd St
- 3218 NW 42nd St
- 3229 NW 42nd St
- 3220 NW 43rd St
- 3151 NW 42nd St