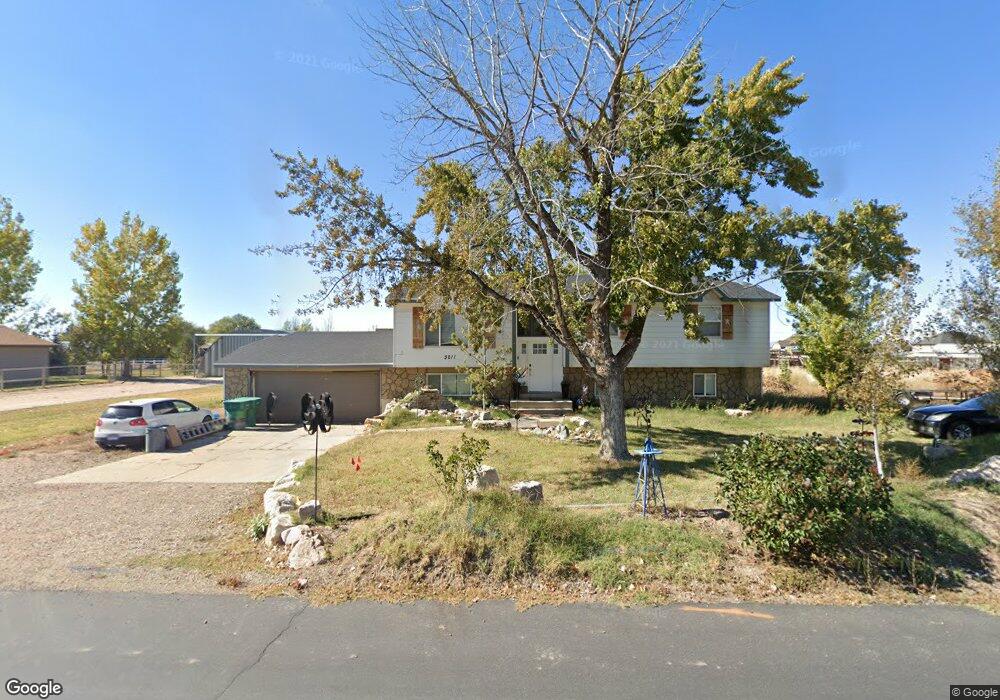
3211 S 2850 W West Haven, UT 84401
Estimated Value: $566,000 - $663,332
4
Beds
2
Baths
2,432
Sq Ft
$247/Sq Ft
Est. Value
About This Home
This home is located at 3211 S 2850 W, West Haven, UT 84401 and is currently estimated at $600,583, approximately $246 per square foot. 3211 S 2850 W is a home located in Weber County with nearby schools including Kanesville Elementary School, Rocky Mountain Junior High School, and Fremont High School.
Ownership History
Date
Name
Owned For
Owner Type
Purchase Details
Closed on
Dec 20, 2018
Sold by
Nelson Michael and Nelson Rebecca
Bought by
Corbin Martel V
Current Estimated Value
Home Financials for this Owner
Home Financials are based on the most recent Mortgage that was taken out on this home.
Original Mortgage
$302,911
Outstanding Balance
$271,071
Interest Rate
5.62%
Mortgage Type
FHA
Estimated Equity
$329,512
Purchase Details
Closed on
Jan 14, 2010
Sold by
Woodward Roddy
Bought by
Sharp David Elvis and Sharp Roddy
Home Financials for this Owner
Home Financials are based on the most recent Mortgage that was taken out on this home.
Original Mortgage
$196,847
Interest Rate
5.37%
Mortgage Type
FHA
Purchase Details
Closed on
Jul 10, 2000
Sold by
Moore Gary R and Moore Marilyn G
Bought by
Woodward Roddy
Home Financials for this Owner
Home Financials are based on the most recent Mortgage that was taken out on this home.
Original Mortgage
$146,400
Interest Rate
8.63%
Create a Home Valuation Report for This Property
The Home Valuation Report is an in-depth analysis detailing your home's value as well as a comparison with similar homes in the area
Home Values in the Area
Average Home Value in this Area
Purchase History
| Date | Buyer | Sale Price | Title Company |
|---|---|---|---|
| Corbin Martel V | -- | Backman Ntp | |
| Sharp David Elvis | -- | Intermountain Title | |
| Woodward Roddy | -- | Backman Stewart Title |
Source: Public Records
Mortgage History
| Date | Status | Borrower | Loan Amount |
|---|---|---|---|
| Open | Corbin Martel V | $302,911 | |
| Previous Owner | Sharp David Elvis | $196,847 | |
| Previous Owner | Woodward Roddy | $146,400 | |
| Closed | Woodward Roddy | $18,300 |
Source: Public Records
Tax History Compared to Growth
Tax History
| Year | Tax Paid | Tax Assessment Tax Assessment Total Assessment is a certain percentage of the fair market value that is determined by local assessors to be the total taxable value of land and additions on the property. | Land | Improvement |
|---|---|---|---|---|
| 2025 | $4,281 | $556,089 | $224,377 | $331,712 |
| 2024 | $4,063 | $326,644 | $144,354 | $182,290 |
| 2023 | $3,822 | $309,048 | $113,304 | $195,744 |
| 2022 | $3,642 | $283,250 | $98,721 | $184,529 |
| 2021 | $3,129 | $391,002 | $111,400 | $279,602 |
| 2020 | $2,937 | $343,000 | $101,400 | $241,600 |
| 2019 | $2,765 | $310,001 | $100,200 | $209,801 |
| 2018 | $2,718 | $301,001 | $100,200 | $200,801 |
| 2017 | $2,352 | $254,999 | $91,950 | $163,049 |
| 2016 | $2,111 | $135,567 | $50,200 | $85,367 |
| 2015 | $2,109 | $135,263 | $50,200 | $85,063 |
| 2014 | $1,977 | $124,817 | $50,200 | $74,617 |
Source: Public Records
Map
Nearby Homes
- 3158 S 2985 W
- 2637 W 3125 S
- 3140 S Straight St
- 2837 W 2875 S
- 3444 S 3100 W Unit 154
- 3452 S 3100 W Unit 152
- 3179 W 3200 S
- 2869 S 2700 W
- 3148 W 3450 S Unit 160
- 3156 W 3450 St S Unit 161
- 2878 2850 S
- 3165 W 3475 S Unit 167
- 3155 W St Unit 168
- 3170 S 3300 W Unit 402
- 2448 W Anne Ave
- 3243 S 2400 W
- 3133 S 3300 W
- 3109 S 3300 W Unit 5
- 3130 S 3300 W Unit 8
- 3121 S 3300 W Unit 4
- 3275 S 2850 W
- 3230 S 2850 W
- 3206 S 2850 W
- 3289 S 2850 W
- 3205 S 2850 W
- 3172 S 2850 W
- 3161 S 2850 W
- 3252 S 2850 W
- 2858 W 3300 S
- 2774 W 3300 S
- 3190 S 2985 W Unit 10
- 3190 S 2985 W
- 3210 S 2985 W Unit 2
- 3130 S 2985 W Unit 7
- 3130 S 2985 W
- 3170 S 2850 W
- 271 W Chimney Rock Dr
- 279 W Chimney Rock Dr
- 2890 W 3300 S
- 3139 S 2850 W