
Seller's Agent in 2019
TerryDon Curtis
Keller Williams Preferred
(918) 808-5847
64 Total Sales
Estimated Value: $252,000 - $285,260
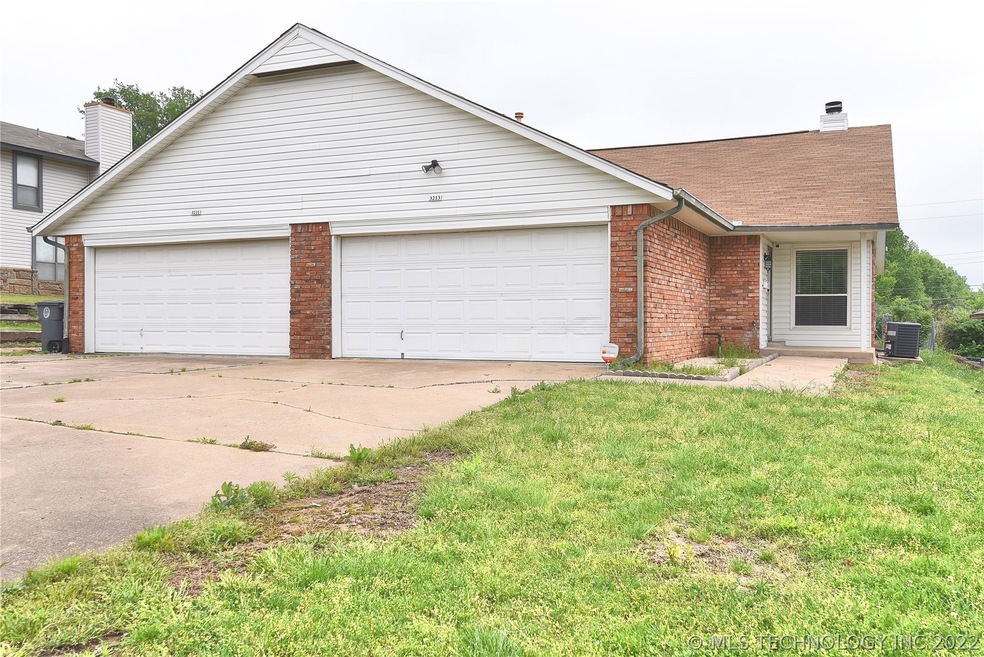
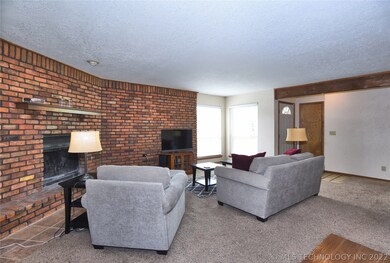
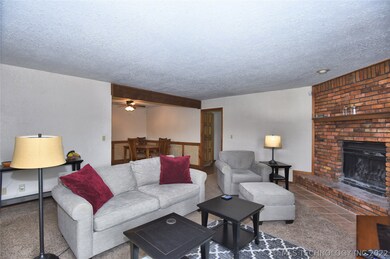
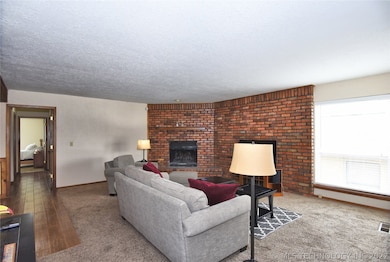
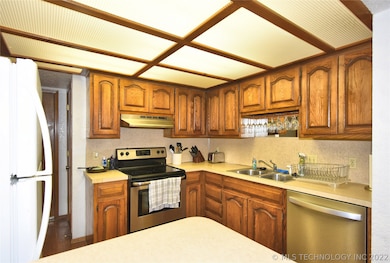
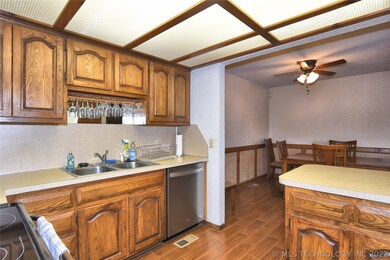
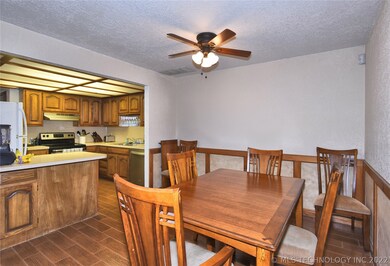
Great investment opportunity, very clean, two unit duplex, each side currently rented. Each side has 2 bedrooms, 2 car garage, 2 baths, gas fireplace, enclosed patio, Midtown location for was access to BA Expressway.
Last Agent to Sell the Property
Keller Williams Preferred License #174212 Listed on: 05/02/2019
| Date | Buyer | Sale Price | Title Company |
|---|---|---|---|
| Johnson Bradford Regenold | $165,000 | Elite Title Services Llc |
| Date | Status | Borrower | Loan Amount |
|---|---|---|---|
| Open | Johnson Bradford Regenold | $123,750 |
| Date | Event | Price | List to Sale | Price per Sq Ft |
|---|---|---|---|---|
| 06/17/2019 06/17/19 | Sold | $165,000 | 0.0% | $58 / Sq Ft |
| 05/02/2019 05/02/19 | Pending | -- | -- | -- |
| 05/02/2019 05/02/19 | For Sale | $165,000 | -- | $58 / Sq Ft |
| Year | Tax Paid | Tax Assessment Tax Assessment Total Assessment is a certain percentage of the fair market value that is determined by local assessors to be the total taxable value of land and additions on the property. | Land | Improvement |
|---|---|---|---|---|
| 2024 | $2,303 | $18,150 | $1,320 | $16,830 |
| 2023 | $2,303 | $18,150 | $1,320 | $16,830 |
| 2022 | $2,420 | $18,150 | $1,320 | $16,830 |
| 2021 | $2,397 | $18,150 | $1,320 | $16,830 |
| 2020 | $2,364 | $18,150 | $1,320 | $16,830 |
| 2019 | $1,994 | $14,553 | $1,320 | $13,233 |
| 2018 | $1,999 | $14,553 | $1,320 | $13,233 |
| 2017 | $1,995 | $14,553 | $1,320 | $13,233 |
| 2016 | $1,954 | $14,553 | $1,320 | $13,233 |
| 2015 | $1,958 | $14,553 | $1,320 | $13,233 |
| 2014 | $1,939 | $14,553 | $1,320 | $13,233 |
Seller's Agent in 2019
TerryDon Curtis
Keller Williams Preferred
(918) 808-5847
64 Total Sales
Source: MLS Technology
MLS Number: 1916415
APN: 19626-93-22-14410
Disclaimer: Certain information contained herein is derived from information provided by parties other than Homes.com. All information provided is deemed reliable, but is not guaranteed to be accurate and should be independently verified.
![]() IDX information is provided exclusively for personal, non-commercial use, and may not be used for any purpose other than to identify prospective properties consumers may be interested in purchasing.
IDX information is provided exclusively for personal, non-commercial use, and may not be used for any purpose other than to identify prospective properties consumers may be interested in purchasing.
Information is deemed reliable but not guaranteed.