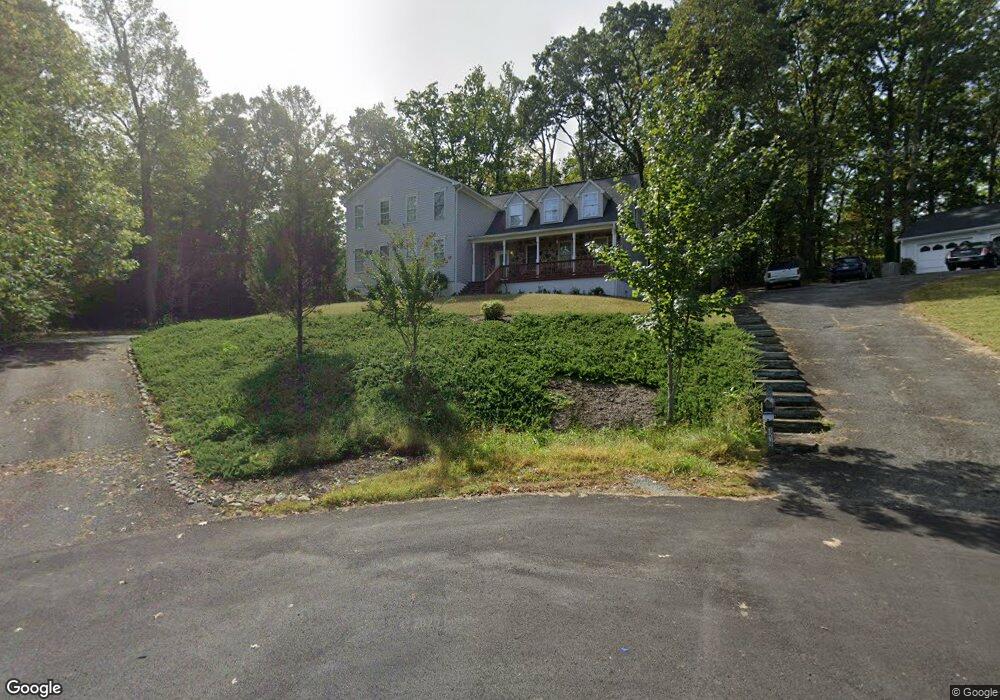
3211 Shoreview Rd Triangle, VA 22172
Estimated Value: $720,000 - $828,721
5
Beds
4
Baths
3,687
Sq Ft
$211/Sq Ft
Est. Value
About This Home
This home is located at 3211 Shoreview Rd, Triangle, VA 22172 and is currently estimated at $778,180, approximately $211 per square foot. 3211 Shoreview Rd is a home located in Prince William County with nearby schools including Triangle Elementary School, Graham Park Middle School, and Potomac High School.
Ownership History
Date
Name
Owned For
Owner Type
Purchase Details
Closed on
Feb 2, 2024
Sold by
Mendez Sergio A and Mendez Judith A
Bought by
Sergio Antonio Mendez Revocable Trust and Judith Ann Gebhardt Revocable Trust
Current Estimated Value
Purchase Details
Closed on
Oct 25, 2007
Sold by
First Natl Bank Of Arizon
Bought by
Mendez Sergio A and Mendez Gebhardt,Judith A
Home Financials for this Owner
Home Financials are based on the most recent Mortgage that was taken out on this home.
Original Mortgage
$304,000
Interest Rate
6.39%
Mortgage Type
New Conventional
Purchase Details
Closed on
Apr 16, 2007
Sold by
Specialized Inc Of Va Sub
Bought by
First Natl Bank Of Arizona
Create a Home Valuation Report for This Property
The Home Valuation Report is an in-depth analysis detailing your home's value as well as a comparison with similar homes in the area
Home Values in the Area
Average Home Value in this Area
Purchase History
| Date | Buyer | Sale Price | Title Company |
|---|---|---|---|
| Sergio Antonio Mendez Revocable Trust | -- | None Listed On Document | |
| Mendez Sergio A | $380,000 | -- | |
| First Natl Bank Of Arizona | $495,000 | -- |
Source: Public Records
Mortgage History
| Date | Status | Borrower | Loan Amount |
|---|---|---|---|
| Previous Owner | Mendez Sergio A | $304,000 |
Source: Public Records
Tax History
| Year | Tax Paid | Tax Assessment Tax Assessment Total Assessment is a certain percentage of the fair market value that is determined by local assessors to be the total taxable value of land and additions on the property. | Land | Improvement |
|---|---|---|---|---|
| 2025 | $6,477 | $707,500 | $197,700 | $509,800 |
| 2024 | $6,477 | $651,300 | $183,100 | $468,200 |
| 2023 | $6,297 | $605,200 | $169,600 | $435,600 |
| 2022 | $6,231 | $562,600 | $157,100 | $405,500 |
| 2021 | $6,312 | $518,000 | $149,700 | $368,300 |
| 2020 | $7,110 | $458,700 | $133,700 | $325,000 |
| 2019 | $7,204 | $464,800 | $133,700 | $331,100 |
| 2018 | $5,195 | $430,200 | $127,300 | $302,900 |
| 2017 | $5,171 | $419,500 | $123,600 | $295,900 |
| 2016 | $5,144 | $421,300 | $123,600 | $297,700 |
| 2015 | $4,906 | $419,700 | $122,400 | $297,300 |
| 2014 | $4,906 | $392,900 | $114,400 | $278,500 |
Source: Public Records
Map
Nearby Homes
- 3203 Riverview Dr
- 3202 Riverview Dr
- 18550 Kerill Rd
- 3209 Riverview Dr
- 18747 Pier Trail Dr
- 3234 Riverview Dr
- 18776 Pier Trail Dr
- 3508 Germainia Ct
- 3511 Germainia Ct
- 18905 Red Oak Ln
- 18306 Possum Point Rd
- 3992 Shire Meadow Ln
- 3671 Expedition Dr
- 19017 Barnette Cir
- 3170 Oakmont Ave
- 3320 Mccorkle Ct
- 17292 Turnstone Dr
- 19204 Cardinal Heights Rd
- 3615 Wharf Ln
- 3618 Wharf Ln
- 3236 Lost Pond Ct
- 3209 Shoreview Rd
- 3210 Shoreview Rd
- 3174 Elm Ct
- 3232 Lost Pond Ct
- 3207 Shoreview Rd
- 3172 Elm Ct
- 3208 Shoreview Rd
- 3228 Lost Pond Ct
- 3206 Shoreview Rd
- 3229 Lost Pond Ct
- 3205 Shoreview Rd
- 18428 Cedar Dr
- 3173 Elm Ct
- 3204 Shoreview Rd
- 3203 Shoreview Rd
- 3225 Lost Pond Ct
- 18510 Cabin Rd
- 18514 Cabin Rd
- 18426 Cedar Dr
Your Personal Tour Guide
Ask me questions while you tour the home.