Estimated Value: $273,000 - $289,435
2
Beds
2
Baths
1,286
Sq Ft
$219/Sq Ft
Est. Value
About This Home
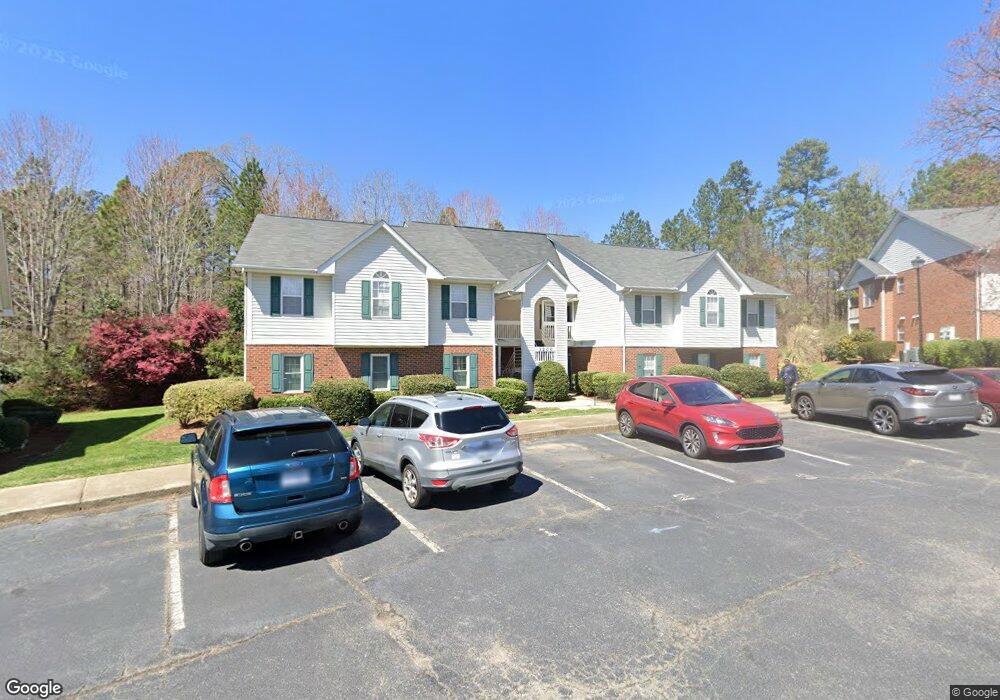
This home is located at 3211 Wellington Ridge Loop, Cary, NC 27518 and is currently estimated at $281,109, approximately $218 per square foot. 3211 Wellington Ridge Loop is a home located in Wake County with nearby schools including Dillard Drive Magnet Elementary School, Dillard Drive Magnet Middle School, and Resurrection Lutheran School.
Ownership History
Date
Name
Owned For
Owner Type
Purchase Details
Closed on
Oct 27, 2025
Sold by
Bailey Phillip Alva and Bailey Glenys E
Bought by
Phillip And Glenys Bailey Revocable Living Tr and Bailey
Current Estimated Value
Purchase Details
Closed on
Mar 26, 2020
Sold by
Gross Charles A and Gross Ann V
Bought by
Bailey Phillip Alva and Bailey Glenys E
Home Financials for this Owner
Home Financials are based on the most recent Mortgage that was taken out on this home.
Original Mortgage
$65,000
Interest Rate
3.25%
Mortgage Type
New Conventional
Purchase Details
Closed on
Aug 17, 2012
Sold by
Gross Marjorie R
Bought by
Gross Charles A and Marjorie R Gross Irrevocable Trust
Create a Home Valuation Report for This Property
The Home Valuation Report is an in-depth analysis detailing your home's value as well as a comparison with similar homes in the area
Home Values in the Area
Average Home Value in this Area
Purchase History
| Date | Buyer | Sale Price | Title Company |
|---|---|---|---|
| Phillip And Glenys Bailey Revocable Living Tr | -- | None Listed On Document | |
| Bailey Phillip Alva | $188,000 | Neuse Title Services | |
| Bailey Phillip Alva | $188,000 | None Listed On Document | |
| Gross Charles A | -- | None Available | |
| Gross Charles A | $2,000 | None Available |
Source: Public Records
Mortgage History
| Date | Status | Borrower | Loan Amount |
|---|---|---|---|
| Previous Owner | Bailey Phillip Alva | $65,000 |
Source: Public Records
Tax History Compared to Growth
Tax History
| Year | Tax Paid | Tax Assessment Tax Assessment Total Assessment is a certain percentage of the fair market value that is determined by local assessors to be the total taxable value of land and additions on the property. | Land | Improvement |
|---|---|---|---|---|
| 2025 | $2,317 | $267,976 | -- | $267,976 |
| 2024 | $2,267 | $267,976 | $0 | $267,976 |
| 2023 | $1,847 | $182,384 | $0 | $182,384 |
| 2022 | $1,779 | $182,384 | $0 | $182,384 |
| 2021 | $1,744 | $182,384 | $0 | $182,384 |
| 2020 | $1,753 | $182,384 | $0 | $182,384 |
| 2019 | $1,362 | $125,374 | $0 | $125,374 |
| 2018 | $1,279 | $125,374 | $0 | $125,374 |
| 2017 | $1,230 | $125,374 | $0 | $125,374 |
| 2016 | $1,212 | $125,374 | $0 | $125,374 |
| 2015 | $1,185 | $118,340 | $0 | $118,340 |
| 2014 | $1,118 | $118,340 | $0 | $118,340 |
Source: Public Records
Map
Nearby Homes
- 3612 Wellington Ridge Loop
- 4311 Wellington Ridge Loop
- 1221 Renshaw Ct
- 304 W Kirkfield Dr
- 1641 Kildonan Place
- 2414 Stephens Rd
- 1640 Glengarry Dr
- 111 W Laurenbrook Ct
- 0 SE Cary Pkwy Unit 2491180
- 301 Dunhagan Place
- 307 Durington Place
- 104 Catherwood Place
- 6315 Tryon Rd
- 2434 Stephens Rd
- 106 Frank Rd
- 1331 Kingston Ridge Rd
- 109 Beaver Pine Way
- 105 Headlands Ln
- 121 Bay Dr
- 1404 Rock Creek Ln
- 3223 Wellington Ridge Loop
- 3222 Wellington Ridge Loop Unit 10
- 3223 Wellington Loop Unit 3223
- 3022 Wellington Ridge Loop
- 3212 Wellington Ridge Loop
- 3322 Wellington Ridge Loop
- 3013 Wellington Ridge Loop Unit 9
- 3012 Wellington Ridge Loop
- 3023 Wellington Ridge Loop
- 3021 Wellington Ridge Loop
- 3011 Wellington Ridge Loop
- 2822 Wellington Ridge Loop
- 2812 Wellington Ridge Loop
- 3213 Wellington Ridge Loop
- 3613 Wellington Ridge Loop Unit 3613
- 3621 Wellington Ridge Loop
- 3613 Wellington Ridge Loop
- 3421 Wellington Ridge Loop
- 3221 Wellington Ridge Loop
- 3411 Wellington Ridge Loop Unit 3411