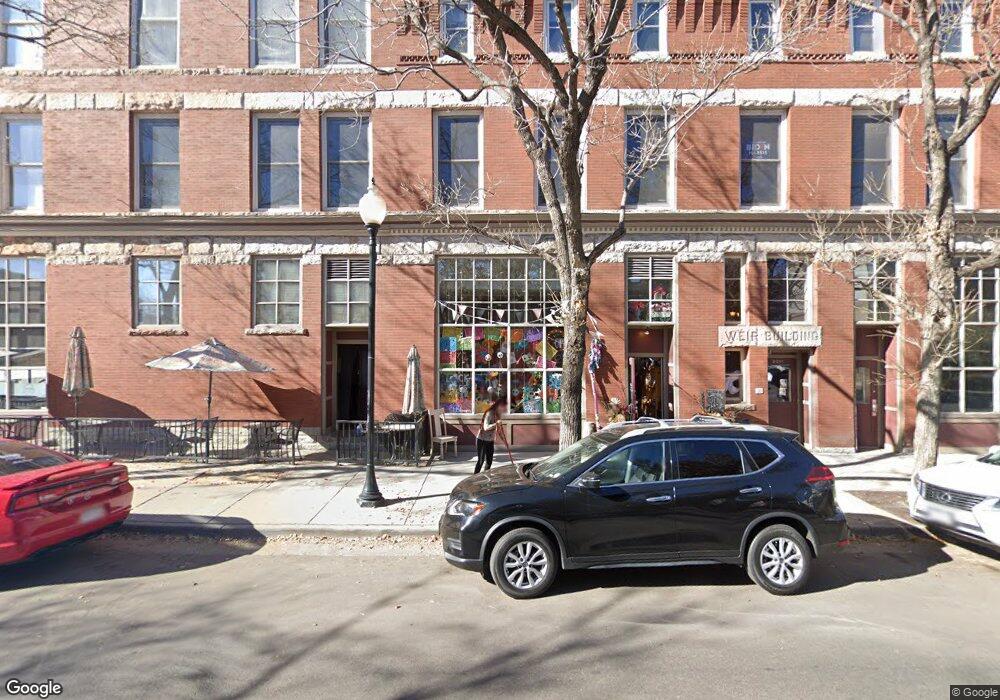
3211 Zuni St Unit 10 Denver, CO 80211
Highland NeighborhoodEstimated Value: $484,000 - $516,715
2
Beds
2
Baths
935
Sq Ft
$531/Sq Ft
Est. Value
About This Home
This home is located at 3211 Zuni St Unit 10, Denver, CO 80211 and is currently estimated at $496,929, approximately $531 per square foot. 3211 Zuni St Unit 10 is a home located in Denver County with nearby schools including Bryant Webster Dual Language School, Edison Elementary School, and Denver Montessori Junior/Senior High School.
Ownership History
Date
Name
Owned For
Owner Type
Purchase Details
Closed on
Jan 12, 2021
Sold by
3211 Zuni 10 Llc
Bought by
Smith Lacey Ann
Current Estimated Value
Home Financials for this Owner
Home Financials are based on the most recent Mortgage that was taken out on this home.
Original Mortgage
$344,000
Outstanding Balance
$307,021
Interest Rate
2.71%
Mortgage Type
New Conventional
Estimated Equity
$189,908
Purchase Details
Closed on
Jan 20, 2011
Sold by
Schleu Robert J and Schleu Elisabeth
Bought by
3211 Zuni #10 Llc
Purchase Details
Closed on
Oct 28, 2004
Sold by
32Z Llc
Bought by
Schleu Elisabeth and Schleu Robert J
Home Financials for this Owner
Home Financials are based on the most recent Mortgage that was taken out on this home.
Original Mortgage
$186,000
Interest Rate
5%
Mortgage Type
New Conventional
Create a Home Valuation Report for This Property
The Home Valuation Report is an in-depth analysis detailing your home's value as well as a comparison with similar homes in the area
Home Values in the Area
Average Home Value in this Area
Purchase History
| Date | Buyer | Sale Price | Title Company |
|---|---|---|---|
| Smith Lacey Ann | $430,000 | First Integrity Title Co | |
| 3211 Zuni #10 Llc | -- | None Available | |
| Schleu Elisabeth | $232,500 | Land Title |
Source: Public Records
Mortgage History
| Date | Status | Borrower | Loan Amount |
|---|---|---|---|
| Open | Smith Lacey Ann | $344,000 | |
| Previous Owner | Schleu Elisabeth | $186,000 | |
| Closed | Schleu Elisabeth | $23,250 |
Source: Public Records
Tax History Compared to Growth
Tax History
| Year | Tax Paid | Tax Assessment Tax Assessment Total Assessment is a certain percentage of the fair market value that is determined by local assessors to be the total taxable value of land and additions on the property. | Land | Improvement |
|---|---|---|---|---|
| 2024 | $2,420 | $30,560 | $2,280 | $28,280 |
| 2023 | $2,368 | $30,560 | $2,280 | $28,280 |
| 2022 | $2,345 | $29,490 | $2,070 | $27,420 |
| 2021 | $2,345 | $30,340 | $2,130 | $28,210 |
| 2020 | $2,247 | $30,290 | $2,130 | $28,160 |
| 2019 | $2,184 | $30,290 | $2,130 | $28,160 |
| 2018 | $2,272 | $29,370 | $1,840 | $27,530 |
| 2017 | $2,265 | $29,370 | $1,840 | $27,530 |
| 2016 | $2,263 | $27,750 | $1,863 | $25,887 |
| 2015 | $2,168 | $27,750 | $1,863 | $25,887 |
| 2014 | $1,862 | $22,420 | $1,528 | $20,892 |
Source: Public Records
Map
Nearby Homes
- 3211 Zuni St Unit 9
- 3211 Zuni St Unit 14
- 2441 W Caithness Place
- 2460 W Caithness Place Unit 104
- 2480 W Caithness Place Unit 2
- 3030 Wyandot St Unit 7
- 2600 W Argyle Place
- 2115 W 32nd Ave Unit 2
- 2121 W 33rd Ave
- 2223 W 34th Ave
- 3453 Alcott St
- 2743-2749 Bryant St
- 3122 Umatilla St
- 3233 Tejon St Unit 305
- 3035 Umatilla St Unit 3035
- 2719 W 32nd Ave
- 3323 Clay St
- 3418 Vallejo St
- 2535 W 35th Ave
- 2731 W 32nd Ave
- 3211 Zuni St Unit 16
- 3211 Zuni St Unit 15
- 3211 Zuni St Unit 13
- 3211 Zuni St Unit 12
- 3211 Zuni St Unit 11
- 3211 Zuni St Unit 8
- 3211 Zuni St Unit 7
- 3211 Zuni St Unit 6
- 3211 Zuni St Unit 5
- 3211 Zuni St Unit 4
- 3211 Zuni St Unit 3
- 3211 Zuni St Unit 2
- 3211 Zuni St Unit 1
- 3211 Zuni St
- 3211 Zuni St
- 2405 W 32nd Ave
- 3215 Zuni St
- 2417 W 32nd Ave 2417 W 32nd Ave Unit 5
- 2417 W 32nd Ave
- 2417 W 32nd Ave Unit 2