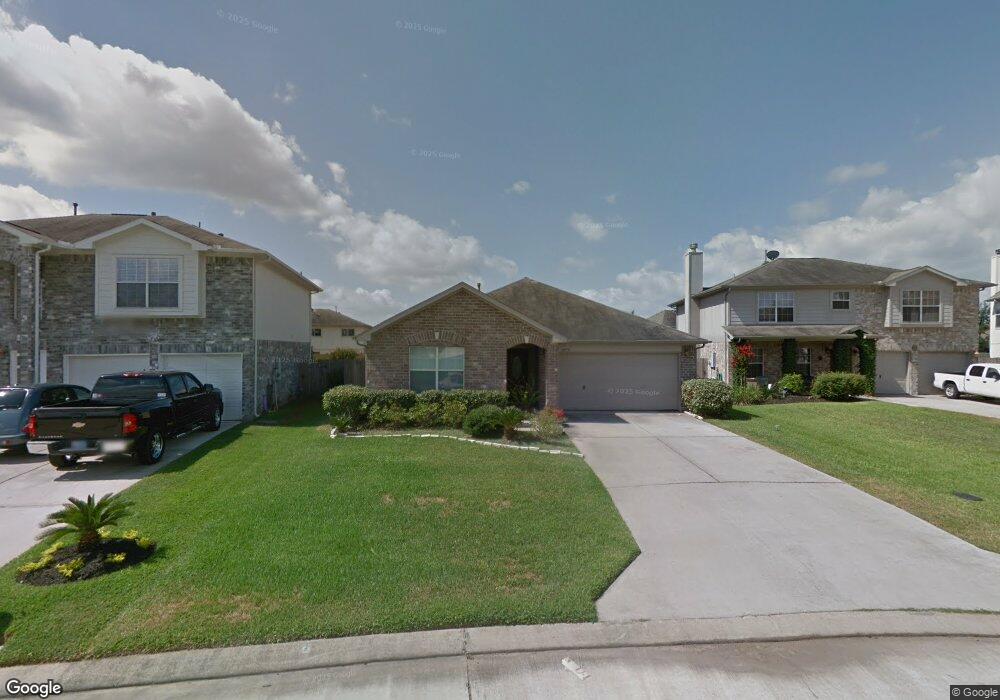
32115 Sue Ln Pinehurst, TX 77362
Estimated Value: $261,000 - $282,000
3
Beds
2
Baths
1,909
Sq Ft
$140/Sq Ft
Est. Value
About This Home
This home is located at 32115 Sue Ln, Pinehurst, TX 77362 and is currently estimated at $268,022, approximately $140 per square foot. 32115 Sue Ln is a home located in Montgomery County with nearby schools including Decker Prairie Elementary School, Tomball Intermediate School, and Tomball Junior High School.
Ownership History
Date
Name
Owned For
Owner Type
Purchase Details
Closed on
May 27, 2008
Sold by
Souheaver Guy
Bought by
Tomblin William M
Current Estimated Value
Home Financials for this Owner
Home Financials are based on the most recent Mortgage that was taken out on this home.
Original Mortgage
$104,000
Outstanding Balance
$66,188
Interest Rate
5.89%
Mortgage Type
Purchase Money Mortgage
Estimated Equity
$201,834
Purchase Details
Closed on
Jul 31, 2003
Sold by
Royce Homes Lp
Bought by
Souheaver Guy
Home Financials for this Owner
Home Financials are based on the most recent Mortgage that was taken out on this home.
Original Mortgage
$134,050
Interest Rate
5.19%
Mortgage Type
FHA
Purchase Details
Closed on
Jan 23, 2003
Sold by
Decker Oaks Land Co Ltd
Bought by
Tomblin William M
Create a Home Valuation Report for This Property
The Home Valuation Report is an in-depth analysis detailing your home's value as well as a comparison with similar homes in the area
Purchase History
| Date | Buyer | Sale Price | Title Company |
|---|---|---|---|
| Tomblin William M | -- | United Title Of Texas | |
| Souheaver Guy | -- | Stewart Title | |
| Tomblin William M | -- | -- | |
| Royce Homes Lp | -- | Stewart Title |
Source: Public Records
Mortgage History
| Date | Status | Borrower | Loan Amount |
|---|---|---|---|
| Open | Tomblin William M | $104,000 | |
| Previous Owner | Souheaver Guy | $134,050 |
Source: Public Records
Tax History
| Year | Tax Paid | Tax Assessment Tax Assessment Total Assessment is a certain percentage of the fair market value that is determined by local assessors to be the total taxable value of land and additions on the property. | Land | Improvement |
|---|---|---|---|---|
| 2025 | $739 | $280,657 | $35,075 | $245,582 |
| 2024 | $710 | $267,146 | -- | -- |
| 2023 | $710 | $242,860 | $35,080 | $252,100 |
| 2022 | $4,079 | $220,780 | $35,080 | $0 |
| 2021 | $3,857 | $200,710 | $35,080 | $165,630 |
| 2020 | $3,708 | $185,000 | $35,080 | $149,920 |
| 2019 | $3,778 | $191,370 | $35,080 | $156,290 |
| 2018 | $2,410 | $177,150 | $35,080 | $142,070 |
| 2017 | $3,404 | $163,570 | $21,500 | $142,070 |
| 2016 | $3,192 | $153,370 | $21,500 | $138,510 |
| 2015 | $1,617 | $139,430 | $21,500 | $131,770 |
| 2014 | $1,617 | $126,750 | $21,500 | $117,260 |
Source: Public Records
Map
Nearby Homes
- 32102 Annice Ln
- 32211 Decker Oaks Dr
- 32018 Annice Ln
- 32006 Annice Ln
- 11843 Belle Ct
- 12007 Viola Ct
- 12050 Quartersawn Ln
- 25429 Hardin Store Rd
- 12203 Hickory Hollow Ln
- 331 Louvenia Ct
- 322 Louvenia Ct
- 32056 S Wiggins St
- 316 Louvenia Ct
- 11919 Hickory Wood St
- 358 Louvenia Ct
- 1107 Virgie Community Rd
- 605 Ashbrook Ridge Ln
- 32016 S Wiggins St
- 33402 Hillside Dr
- 1223 Virgie Community Rd
- 32111 Sue Ln
- 32119 Sue Ln
- 32106 Anne Ln
- 32107 Sue Ln
- 32123 Sue Ln
- 32110 Anne Ln
- 32102 Anne Ln
- 32114 Anne Ln
- 32026 Anne Ln
- 32103 Sue Ln
- 11751 Elizabeth Ct
- 11811 Elizabeth Ct
- 32118 Anne Ln
- 11747 Elizabeth Ct
- 32022 Anne Ln
- 11815 Elizabeth Ct
- 32019 Sue Ln
- 11819 Elizabeth Ct
- 32122 Anne Ln
- 11743 Elizabeth Ct
Your Personal Tour Guide
Ask me questions while you tour the home.