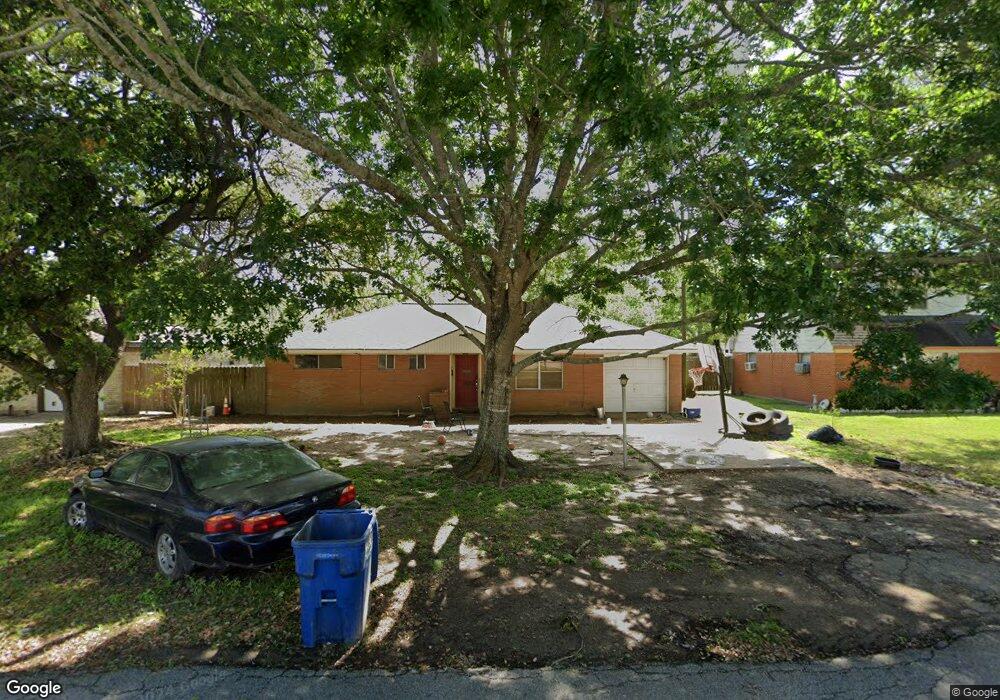
3212 3rd St Bay City, TX 77414
Estimated Value: $130,212 - $149,000
--
Bed
1
Bath
1,140
Sq Ft
$122/Sq Ft
Est. Value
About This Home
This home is located at 3212 3rd St, Bay City, TX 77414 and is currently estimated at $138,553, approximately $121 per square foot. 3212 3rd St is a home located in Matagorda County with nearby schools including John H. Cherry Elementary School, Bay City Junior High School, and Bay City High School.
Ownership History
Date
Name
Owned For
Owner Type
Purchase Details
Closed on
Jun 8, 2017
Sold by
Sabo Andrew W
Bought by
Muskiet Lawrence J and Muskiet Jessica L
Current Estimated Value
Home Financials for this Owner
Home Financials are based on the most recent Mortgage that was taken out on this home.
Original Mortgage
$59,250
Outstanding Balance
$49,297
Interest Rate
4.03%
Mortgage Type
New Conventional
Estimated Equity
$89,256
Purchase Details
Closed on
Mar 10, 2015
Sold by
Maddox Regina Lynn
Bought by
Gateway Mortgage Group Llc
Purchase Details
Closed on
Jul 6, 2012
Sold by
Johnson Clifford Carl and Johnson Robert Mark
Bought by
Maddox Regina Lynn
Home Financials for this Owner
Home Financials are based on the most recent Mortgage that was taken out on this home.
Original Mortgage
$76,530
Interest Rate
3.81%
Mortgage Type
New Conventional
Create a Home Valuation Report for This Property
The Home Valuation Report is an in-depth analysis detailing your home's value as well as a comparison with similar homes in the area
Home Values in the Area
Average Home Value in this Area
Purchase History
| Date | Buyer | Sale Price | Title Company |
|---|---|---|---|
| Muskiet Lawrence J | -- | Bay City Abstract & Title | |
| Gateway Mortgage Group Llc | $76,530 | Servicelink | |
| Maddox Regina Lynn | -- | None Available |
Source: Public Records
Mortgage History
| Date | Status | Borrower | Loan Amount |
|---|---|---|---|
| Open | Muskiet Lawrence J | $59,250 | |
| Previous Owner | Maddox Regina Lynn | $76,530 |
Source: Public Records
Tax History Compared to Growth
Tax History
| Year | Tax Paid | Tax Assessment Tax Assessment Total Assessment is a certain percentage of the fair market value that is determined by local assessors to be the total taxable value of land and additions on the property. | Land | Improvement |
|---|---|---|---|---|
| 2024 | $30 | $127,900 | $28,950 | $98,950 |
| 2023 | $2,819 | $120,990 | $14,550 | $106,440 |
| 2022 | $2,781 | $104,130 | $10,590 | $93,540 |
| 2021 | $2,568 | $87,400 | $10,590 | $76,810 |
| 2020 | $2,355 | $77,050 | $10,590 | $66,460 |
| 2019 | $2,419 | $79,190 | $10,590 | $68,600 |
| 2018 | $2,396 | $81,340 | $10,590 | $70,750 |
| 2017 | $1,732 | $62,040 | $10,590 | $51,450 |
| 2016 | $2,235 | $80,050 | $10,590 | $69,460 |
| 2015 | -- | $75,350 | $10,590 | $64,760 |
| 2014 | -- | $66,340 | $10,590 | $55,750 |
Source: Public Records
Map
Nearby Homes
- 515 7th St
- 3612 7th St
- 5900 Texas 35
- 2824 5th St
- 2420 Sycamore Ave
- 2508 Sycamore Ave
- 3225 Bucks Bayou Rd
- 2603 Norvell Ave
- 2708 Sycamore Ave
- 3615 Rose St
- 2616 Elm Ave
- 2828 Duberry St
- 2912 9th St
- 1801 Svetlik Ave
- 2928 Fm 2668 Ave
- 3514 Monroe St
- 3512 Monroe St
- 3521 Monroe St
- 3519 Monroe St
- 3508 Monroe St