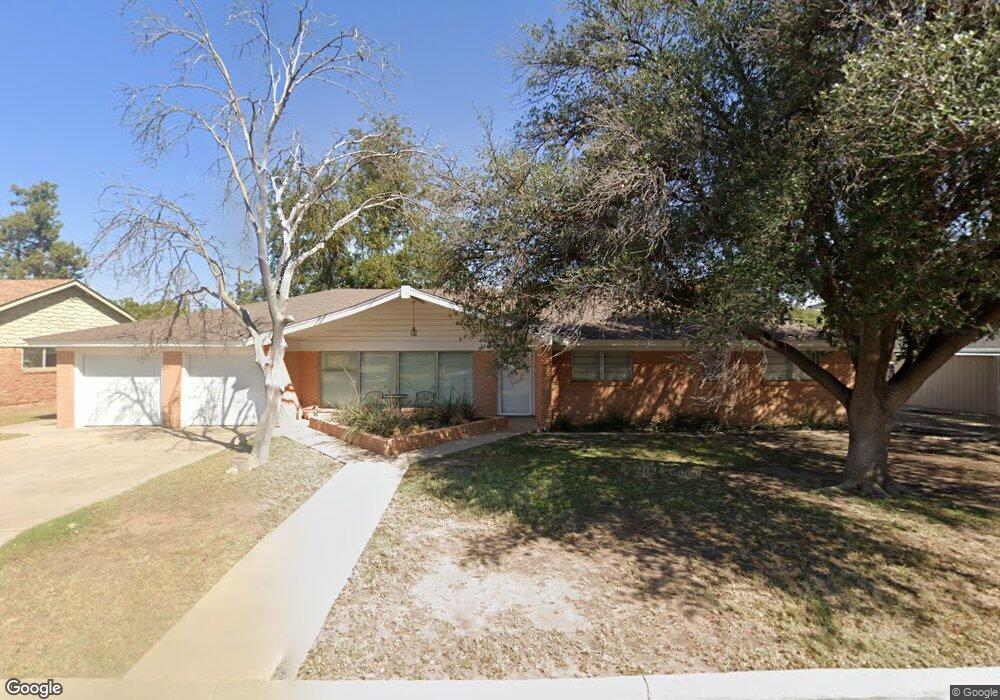
3212 Apperson Dr Midland, TX 79705
Estimated Value: $368,000 - $401,000
--
Bed
2
Baths
2,618
Sq Ft
$146/Sq Ft
Est. Value
About This Home
This home is located at 3212 Apperson Dr, Midland, TX 79705 and is currently estimated at $381,882, approximately $145 per square foot. 3212 Apperson Dr is a home located in Midland County with nearby schools including Midland High School, Robert H. Goddard Junior High School, and Trinity School of Midland.
Ownership History
Date
Name
Owned For
Owner Type
Purchase Details
Closed on
Jul 7, 2009
Sold by
Crass Linda J
Bought by
Marc Inc
Current Estimated Value
Home Financials for this Owner
Home Financials are based on the most recent Mortgage that was taken out on this home.
Original Mortgage
$177,520
Interest Rate
4.97%
Mortgage Type
Purchase Money Mortgage
Purchase Details
Closed on
Feb 1, 2005
Sold by
Vitrano Anthony and Vitrano Janis M
Bought by
Crass Linda J
Purchase Details
Closed on
Jan 2, 2004
Sold by
Miliken Bruce A
Bought by
Marc Inc
Purchase Details
Closed on
Jul 20, 1998
Bought by
Marc Inc
Purchase Details
Closed on
Sep 1, 1987
Bought by
Marc Inc
Purchase Details
Closed on
Feb 6, 1981
Bought by
Marc Inc
Create a Home Valuation Report for This Property
The Home Valuation Report is an in-depth analysis detailing your home's value as well as a comparison with similar homes in the area
Home Values in the Area
Average Home Value in this Area
Purchase History
| Date | Buyer | Sale Price | Title Company |
|---|---|---|---|
| Marc Inc | -- | Lone Star Abstract & Title C | |
| Crass Linda J | -- | None Available | |
| Marc Inc | -- | -- | |
| Marc Inc | -- | -- | |
| Marc Inc | -- | -- | |
| Marc Inc | -- | -- |
Source: Public Records
Mortgage History
| Date | Status | Borrower | Loan Amount |
|---|---|---|---|
| Closed | Marc Inc | $177,520 | |
| Closed | Crass Linda J | $0 |
Source: Public Records
Tax History Compared to Growth
Tax History
| Year | Tax Paid | Tax Assessment Tax Assessment Total Assessment is a certain percentage of the fair market value that is determined by local assessors to be the total taxable value of land and additions on the property. | Land | Improvement |
|---|---|---|---|---|
| 2025 | -- | $320,710 | $31,520 | $289,190 |
| 2024 | -- | $302,070 | $31,520 | $270,550 |
| 2023 | $4,413 | $294,500 | $31,520 | $262,980 |
| 2022 | $4,752 | $304,160 | $31,520 | $272,640 |
| 2021 | $5,122 | $294,020 | $31,520 | $262,500 |
| 2020 | $5,043 | $291,000 | $31,520 | $259,480 |
| 2019 | $5,509 | $291,000 | $31,520 | $259,480 |
| 2018 | $4,996 | $256,930 | $31,520 | $225,410 |
| 2017 | $4,725 | $243,000 | $31,520 | $211,480 |
| 2016 | $0 | $242,400 | $31,520 | $210,880 |
| 2015 | -- | $242,400 | $31,520 | $210,880 |
| 2014 | -- | $238,520 | $0 | $0 |
Source: Public Records
Map
Nearby Homes
- 3204 W Wadley Ave
- 3207 Marmon Dr
- 3200 Durant Dr
- 3200 W Wadley Ave
- 3205 Maxwell Dr
- 3203 Maxwell Dr
- 3323 Maxwell Dr
- 3200 Whitney Dr
- 3 Marinor Ct
- 3105 Auburn Dr
- 2817 Maxwell Dr
- 3322 Providence Dr
- 2811 Durant Dr
- 3302 Windsor Dr
- 3235 W Shandon Ave
- 4 Amhurst Ct
- 3210 Cimmaron Ave
- 3303 Windsor Dr
- 2824 Cimmaron Ave
- 3227 W Dengar Ave
- 3210 Apperson Dr
- 3214 Apperson Dr
- 3211 Apperson Dr
- 3213 Apperson Dr
- 3208 Apperson Dr
- 3216 Apperson Dr
- 3209 Durant Dr
- 3211 Durant Dr
- 3215 Apperson Dr
- 3207 Durant Dr
- 3307 Cord Dr
- 3209 Apperson Dr
- 3206 Apperson Dr
- 3213 Durant Dr
- 3218 Apperson Dr
- 3205 Durant Dr
- 3207 Apperson Dr
- 3217 Apperson Dr
- 3305 Cord Dr
- 3304 Cord Dr