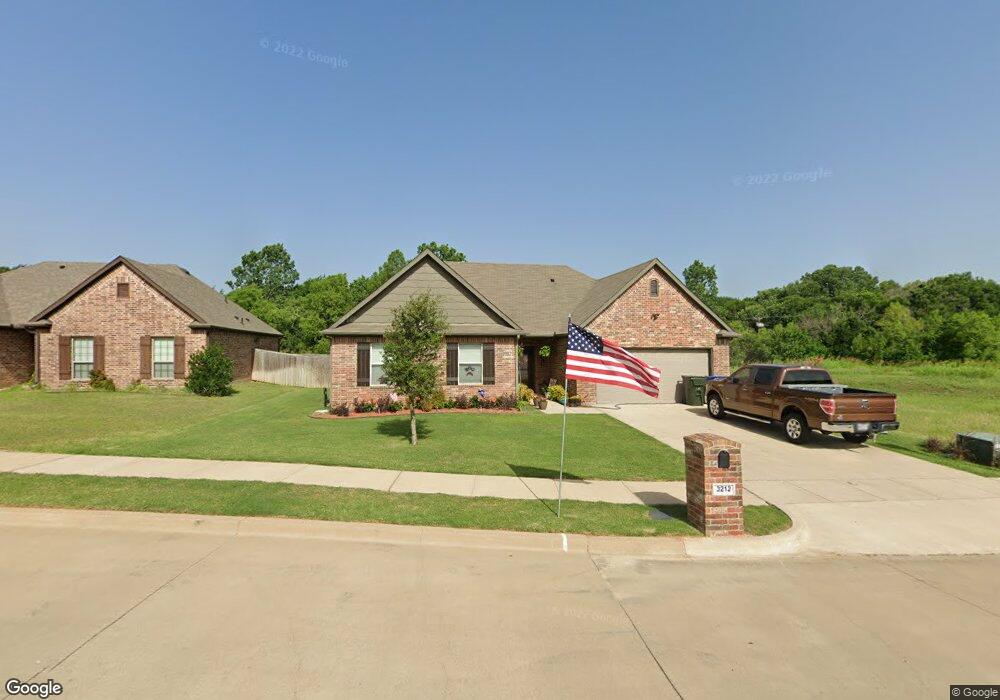
3212 N Haven Dr Sherman, TX 75092
Estimated Value: $299,785 - $348,000
3
Beds
2
Baths
1,611
Sq Ft
$201/Sq Ft
Est. Value
About This Home
This home is located at 3212 N Haven Dr, Sherman, TX 75092 and is currently estimated at $323,893, approximately $201 per square foot. 3212 N Haven Dr is a home located in Grayson County with nearby schools including Fairview Elementary School, Dillingham Intermediate School, and Piner Middle School.
Ownership History
Date
Name
Owned For
Owner Type
Purchase Details
Closed on
Jul 17, 2024
Sold by
Blankenship Barbara N
Bought by
Blankenship Barbara N and Lanning Clinton
Current Estimated Value
Purchase Details
Closed on
Mar 24, 2021
Sold by
Blankenship Haskell L and Blankenship Barbara N
Bought by
Blankenship Haskell L and Blankenship Barbara N
Purchase Details
Closed on
Oct 1, 2020
Sold by
B F Slag Llc
Bought by
Blankenship Haskell L and Blankenship Barbara N
Purchase Details
Closed on
Aug 3, 2015
Sold by
Spavinaw Development Llc
Bought by
Crei Corp
Home Financials for this Owner
Home Financials are based on the most recent Mortgage that was taken out on this home.
Original Mortgage
$121,880
Interest Rate
4.06%
Mortgage Type
Construction
Create a Home Valuation Report for This Property
The Home Valuation Report is an in-depth analysis detailing your home's value as well as a comparison with similar homes in the area
Home Values in the Area
Average Home Value in this Area
Purchase History
| Date | Buyer | Sale Price | Title Company |
|---|---|---|---|
| Blankenship Barbara N | -- | None Listed On Document | |
| Blankenship Haskell L | -- | None Available | |
| Blankenship Haskell L | -- | Red River Title Co | |
| Crei Corp | $27,000 | Chapin Title Co |
Source: Public Records
Mortgage History
| Date | Status | Borrower | Loan Amount |
|---|---|---|---|
| Previous Owner | Crei Corp | $121,880 |
Source: Public Records
Tax History Compared to Growth
Tax History
| Year | Tax Paid | Tax Assessment Tax Assessment Total Assessment is a certain percentage of the fair market value that is determined by local assessors to be the total taxable value of land and additions on the property. | Land | Improvement |
|---|---|---|---|---|
| 2025 | -- | $291,920 | $43,345 | $248,575 |
| 2024 | $6,497 | $296,233 | $0 | $0 |
| 2023 | $6,311 | $269,303 | $0 | $0 |
| 2022 | $5,738 | $244,821 | $0 | $0 |
| 2021 | $5,497 | $219,321 | $29,001 | $190,320 |
| 2020 | $5,396 | $205,592 | $29,001 | $176,591 |
| 2019 | $5,189 | $192,516 | $20,835 | $171,681 |
| 2018 | $4,692 | $187,003 | $20,835 | $166,168 |
| 2017 | $4,384 | $176,101 | $20,835 | $155,266 |
| 2016 | $4,152 | $166,779 | $20,835 | $145,944 |
| 2015 | $0 | $11,671 | $11,671 | $0 |
| 2014 | -- | $11,671 | $11,671 | $0 |
Source: Public Records
Map
Nearby Homes
- 1418 Lexington Dr
- 3217 Redbud Trail
- 3201 Anthony Dr
- 000 Highway 82
- 1610 Idlewood Dr
- 3116 Anthony Dr
- 3205 Mimosa Dr
- 3001 Redbud Trail
- 3300 Rex Cruse Dr
- 1514 Andy Dr
- 1710 Citrus Dr
- 27809 W Us Highway 82
- 26652 W US Highway 82
- 3013 Glasgow Dr
- 1507 Greenbrier Dr
- Plan Angelico at Heritage Ranch - 40ft. lots
- Plan Vermeer at Heritage Ranch - 40ft. lots
- Plan Mondrian at Heritage Ranch - 40ft. lots
- Plan Botticelli at Heritage Ranch - 40ft. lots
- 810 Sagebrush Trail
- 3208 N Haven Dr
- 3204 N Haven Dr
- 1422 Lexington Dr
- 1427 Monfort Dr
- 3200 N Haven Dr
- 1423 Monfort Dr
- 1423 Montfort Dr
- 1421 Lexington Dr
- 1419 Monfort Dr
- 1414 Lexington Dr
- 3142 N Haven Dr
- 1415 Monfort Dr
- 1417 Lexington Dr
- 1410 Lexington Dr
- 1420 Monfort Dr
- 3138 N Haven Dr
- 3213 Redbud Trail
- 1416 Monfort Dr
- 3225 Redbud Trail
- 1411 Monfort Dr