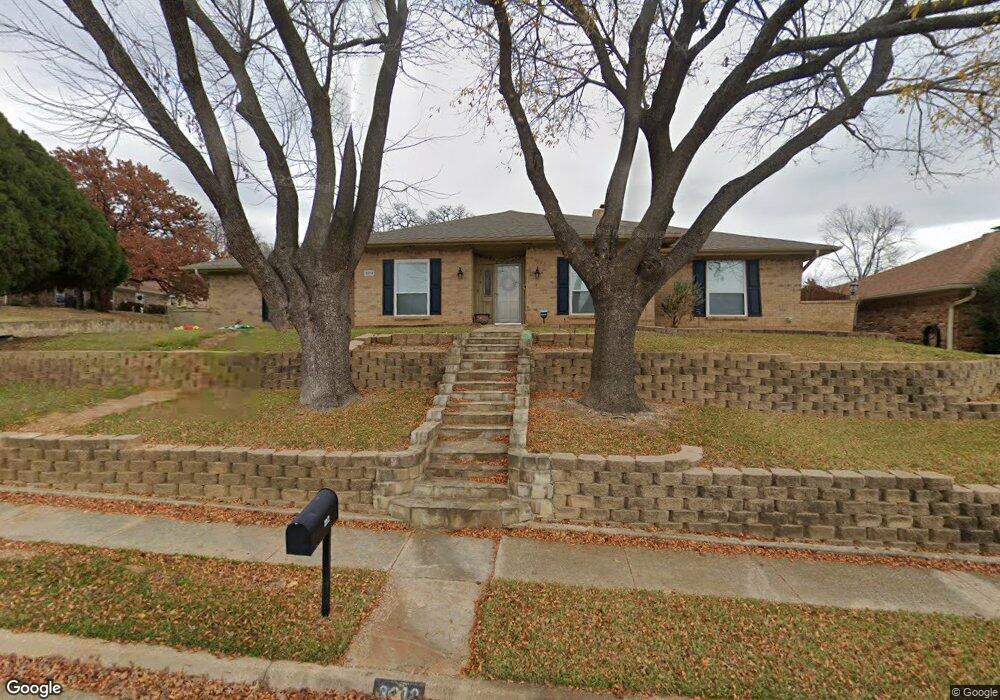
3212 Shady Brook Dr Bedford, TX 76021
Estimated Value: $479,000 - $511,943
5
Beds
3
Baths
2,591
Sq Ft
$190/Sq Ft
Est. Value
About This Home
This home is located at 3212 Shady Brook Dr, Bedford, TX 76021 and is currently estimated at $493,236, approximately $190 per square foot. 3212 Shady Brook Dr is a home located in Tarrant County with nearby schools including Bedford Heights Elementary School, Bedford Junior High School, and L.D. Bell High School.
Ownership History
Date
Name
Owned For
Owner Type
Purchase Details
Closed on
Feb 15, 2019
Sold by
Simon Brandon and Corin Simon L
Bought by
Farrell Marion Yates and Farrell Valerie Jane
Current Estimated Value
Home Financials for this Owner
Home Financials are based on the most recent Mortgage that was taken out on this home.
Original Mortgage
$280,488
Outstanding Balance
$246,096
Interest Rate
4.4%
Mortgage Type
Purchase Money Mortgage
Estimated Equity
$247,140
Purchase Details
Closed on
Mar 28, 2016
Sold by
Spencer Darrell Monroe and Spencer Neal Edward
Bought by
Simon Brandon and Corin Simon L
Home Financials for this Owner
Home Financials are based on the most recent Mortgage that was taken out on this home.
Original Mortgage
$205,018
Interest Rate
3.65%
Mortgage Type
New Conventional
Create a Home Valuation Report for This Property
The Home Valuation Report is an in-depth analysis detailing your home's value as well as a comparison with similar homes in the area
Home Values in the Area
Average Home Value in this Area
Purchase History
| Date | Buyer | Sale Price | Title Company |
|---|---|---|---|
| Farrell Marion Yates | -- | Old Republic Title | |
| Simon Brandon | -- | Rtt |
Source: Public Records
Mortgage History
| Date | Status | Borrower | Loan Amount |
|---|---|---|---|
| Open | Farrell Marion Yates | $280,488 | |
| Previous Owner | Simon Brandon | $205,018 |
Source: Public Records
Tax History Compared to Growth
Tax History
| Year | Tax Paid | Tax Assessment Tax Assessment Total Assessment is a certain percentage of the fair market value that is determined by local assessors to be the total taxable value of land and additions on the property. | Land | Improvement |
|---|---|---|---|---|
| 2025 | $6,580 | $426,779 | $100,000 | $326,779 |
| 2024 | $6,580 | $490,669 | $100,000 | $390,669 |
| 2023 | $7,078 | $490,000 | $75,000 | $415,000 |
| 2022 | $7,327 | $441,053 | $75,000 | $366,053 |
| 2021 | $7,184 | $304,986 | $75,000 | $229,986 |
| 2020 | $7,251 | $304,986 | $75,000 | $229,986 |
| 2019 | $7,409 | $304,986 | $75,000 | $229,986 |
| 2018 | $7,148 | $294,248 | $75,000 | $219,248 |
| 2017 | $6,668 | $275,634 | $50,000 | $225,634 |
| 2016 | $5,709 | $236,011 | $50,000 | $186,011 |
| 2015 | $1,998 | $205,000 | $20,000 | $185,000 |
| 2014 | $1,998 | $205,000 | $20,000 | $185,000 |
Source: Public Records
Map
Nearby Homes
- 913 Kensington Ct
- 3609 Wayne Ct
- 3119 Spring Grove Dr
- 3301 Wendover Ct
- 3213 Spring Valley Dr
- 3624 Wayne Ct
- 1109 Simpson Terrace
- 3605 Spring Valley Dr
- 1209 Hillandale Ct
- 801 Shady Creek Ln
- 1013 Springdale Rd
- 922 Shady Creek Ln
- 909 Brestol Ct W
- 2704 Shady Grove Dr
- 2700 Shady Grove Dr
- 1401 Danielle Dr
- 1136 Wingate Dr
- 628 Huntwich Dr
- 2508 Lakeview Dr
- 2501 Shady Grove Dr
- 3208 Shady Brook Dr
- 1016 Clear View Dr
- 1020 Clear View Dr
- 1001 Clear View Dr
- 936 Clear View Dr
- 3204 Shady Brook Dr
- 1005 Clear View Dr
- 3209 Shady Brook Dr
- 1009 Clear View Dr
- 1024 Clear View Dr
- 937 Clear View Dr
- 932 Clear View Dr
- 3200 Shady Brook Dr
- 3205 Shady Brook Dr
- 1005 Timber View Dr
- 1004 Carousel Dr
- 1000 Carousel Dr
- 1008 Carousel Dr
- 1021 Clear View Dr
- 1013 Clear View Dr