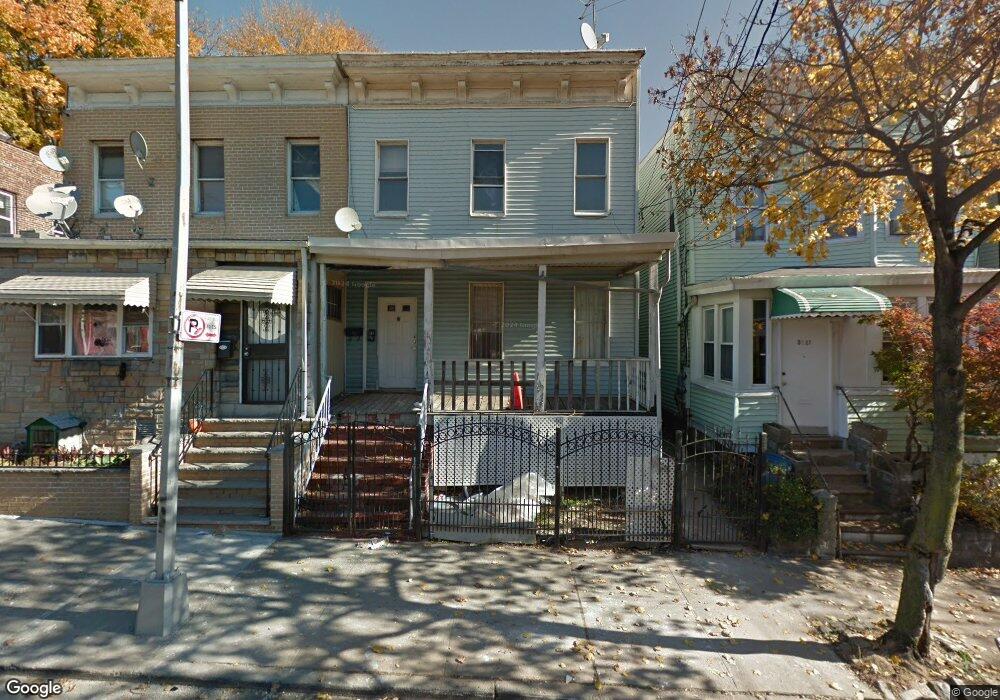
3213 105th St E. Elmhurst, NY 11369
East Elmhurst NeighborhoodEstimated Value: $861,562 - $1,104,000
6
Beds
2
Baths
1,920
Sq Ft
$531/Sq Ft
Est. Value
About This Home
This home is located at 3213 105th St, E. Elmhurst, NY 11369 and is currently estimated at $1,019,141, approximately $530 per square foot. 3213 105th St is a home located in Queens County with nearby schools including Helen M Marshall School, Corona Arts And Sciences Academy, and Flushing High School.
Ownership History
Date
Name
Owned For
Owner Type
Purchase Details
Closed on
May 25, 2017
Sold by
Lee Chui
Bought by
Chen Li Rong and Lee Chui
Current Estimated Value
Home Financials for this Owner
Home Financials are based on the most recent Mortgage that was taken out on this home.
Original Mortgage
$600,000
Outstanding Balance
$497,185
Interest Rate
3.97%
Mortgage Type
Purchase Money Mortgage
Estimated Equity
$521,956
Purchase Details
Closed on
Oct 14, 2016
Sold by
Arluz Realty Corp
Bought by
Zhou Weiou
Purchase Details
Closed on
May 18, 2016
Sold by
Thansingh Parmanand
Bought by
Arluz Realty Corp
Home Financials for this Owner
Home Financials are based on the most recent Mortgage that was taken out on this home.
Original Mortgage
$225,000
Interest Rate
3.56%
Mortgage Type
Purchase Money Mortgage
Purchase Details
Closed on
May 27, 1986
Sold by
Carter Florence and Gabriel Irene
Bought by
Thansingh Paramanand
Create a Home Valuation Report for This Property
The Home Valuation Report is an in-depth analysis detailing your home's value as well as a comparison with similar homes in the area
Home Values in the Area
Average Home Value in this Area
Purchase History
| Date | Buyer | Sale Price | Title Company |
|---|---|---|---|
| Chen Li Rong | -- | -- | |
| Lee Chui | $840,000 | -- | |
| Zhou Weiou | $500,000 | -- | |
| Arluz Realty Corp | $280,000 | -- | |
| Thansingh Paramanand | -- | -- |
Source: Public Records
Mortgage History
| Date | Status | Borrower | Loan Amount |
|---|---|---|---|
| Open | Lee Chui | $600,000 | |
| Previous Owner | Arluz Realty Corp | $225,000 |
Source: Public Records
Tax History Compared to Growth
Tax History
| Year | Tax Paid | Tax Assessment Tax Assessment Total Assessment is a certain percentage of the fair market value that is determined by local assessors to be the total taxable value of land and additions on the property. | Land | Improvement |
|---|---|---|---|---|
| 2025 | $5,224 | $27,192 | $4,049 | $23,143 |
| 2024 | $5,224 | $26,009 | $3,640 | $22,369 |
| 2023 | $5,282 | $26,009 | $3,991 | $22,018 |
| 2022 | $4,971 | $62,040 | $9,060 | $52,980 |
| 2021 | $4,999 | $63,300 | $9,060 | $54,240 |
| 2020 | $4,796 | $54,420 | $9,060 | $45,360 |
| 2019 | $4,534 | $51,240 | $9,060 | $42,180 |
| 2018 | $4,418 | $21,674 | $4,471 | $17,203 |
| 2017 | $4,230 | $20,750 | $5,867 | $14,883 |
| 2016 | $3,957 | $20,750 | $5,867 | $14,883 |
| 2015 | $2,361 | $18,883 | $5,930 | $12,953 |
| 2014 | $2,361 | $18,062 | $5,555 | $12,507 |
Source: Public Records
Map
Nearby Homes
- 105-20 32nd Ave
- 104-08 32nd Ave
- 3219 104th St
- 32-21 106th St
- 32-45 105th St
- 106-10 32nd Ave
- 3258 105th St Unit 4A
- 3258 105th St Unit 6C
- 32-58 105th St Unit 2B
- 3214 108th St
- 32-26 103rd St
- 102-10 32nd Ave
- 3318 104th St
- 31-50 Buell St
- 33-28 105th St
- 101-16 32nd Ave
- 3123 102nd St
- 108-05 Astoria Blvd Unit 1B
- 108-05 Astoria Blvd Unit 6A
- 32-17 110 St