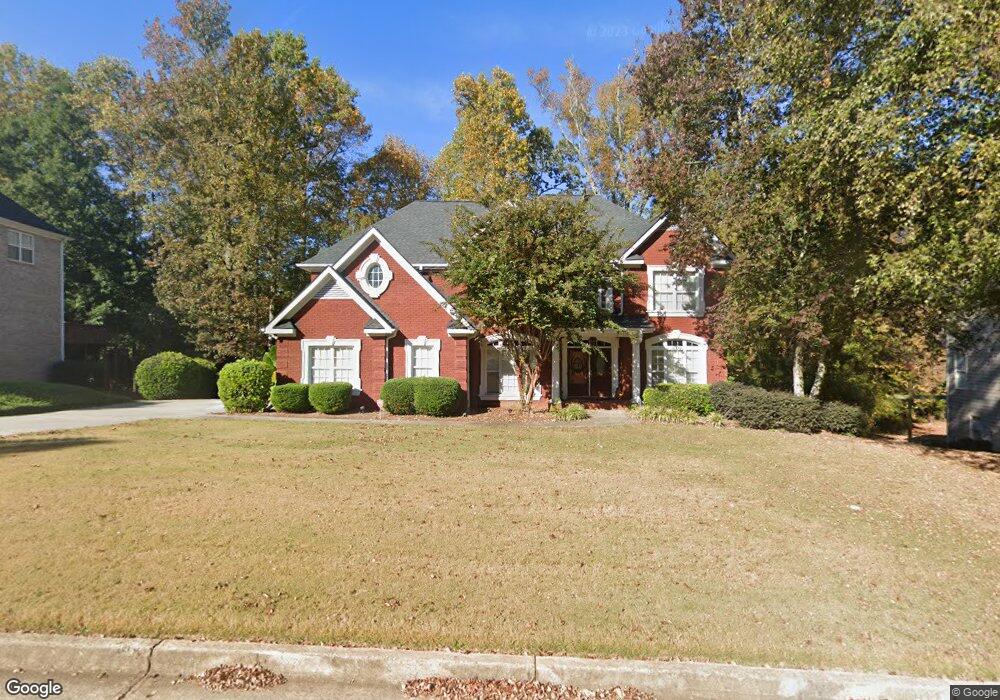
3213 Chadwick Ct SE Conyers, GA 30013
Estimated Value: $463,316 - $531,000
5
Beds
4
Baths
4,635
Sq Ft
$109/Sq Ft
Est. Value
About This Home
This home is located at 3213 Chadwick Ct SE, Conyers, GA 30013 and is currently estimated at $503,329, approximately $108 per square foot. 3213 Chadwick Ct SE is a home located in Rockdale County with nearby schools including Flat Shoals Elementary School, Memorial Middle School, and Salem High School.
Ownership History
Date
Name
Owned For
Owner Type
Purchase Details
Closed on
Sep 30, 2019
Sold by
Edwards Deadra P
Bought by
Corker Yusuf
Current Estimated Value
Home Financials for this Owner
Home Financials are based on the most recent Mortgage that was taken out on this home.
Original Mortgage
$332,859
Outstanding Balance
$291,601
Interest Rate
3.5%
Mortgage Type
FHA
Estimated Equity
$211,728
Purchase Details
Closed on
Jan 30, 2003
Sold by
Five Star Custom Hms Inc
Bought by
Edwards Deadra P and Edwards Kenneth G
Home Financials for this Owner
Home Financials are based on the most recent Mortgage that was taken out on this home.
Original Mortgage
$267,520
Interest Rate
5.98%
Mortgage Type
New Conventional
Create a Home Valuation Report for This Property
The Home Valuation Report is an in-depth analysis detailing your home's value as well as a comparison with similar homes in the area
Home Values in the Area
Average Home Value in this Area
Purchase History
| Date | Buyer | Sale Price | Title Company |
|---|---|---|---|
| Corker Yusuf | $339,000 | -- | |
| Corker Yusuf | -- | -- | |
| Edwards Deadra P | $334,400 | -- |
Source: Public Records
Mortgage History
| Date | Status | Borrower | Loan Amount |
|---|---|---|---|
| Open | Corker Yusuf | $332,859 | |
| Closed | Corker Yusuf | $332,859 | |
| Previous Owner | Edwards Deadra P | $267,520 |
Source: Public Records
Tax History Compared to Growth
Tax History
| Year | Tax Paid | Tax Assessment Tax Assessment Total Assessment is a certain percentage of the fair market value that is determined by local assessors to be the total taxable value of land and additions on the property. | Land | Improvement |
|---|---|---|---|---|
| 2024 | $8,173 | $207,320 | $38,920 | $168,400 |
| 2023 | $7,925 | $195,840 | $33,120 | $162,720 |
| 2022 | $7,674 | $189,520 | $33,120 | $156,400 |
| 2021 | $6,256 | $155,200 | $29,000 | $126,200 |
| 2020 | $5,817 | $135,600 | $24,868 | $110,732 |
| 2019 | $2,636 | $99,480 | $16,000 | $83,480 |
| 2018 | $2,589 | $97,400 | $16,000 | $81,400 |
| 2017 | $2,380 | $89,640 | $16,000 | $73,640 |
| 2016 | $2,199 | $89,640 | $16,000 | $73,640 |
| 2015 | $2,127 | $87,000 | $13,360 | $73,640 |
| 2014 | $1,902 | $87,000 | $13,360 | $73,640 |
| 2013 | -- | $117,040 | $24,000 | $93,040 |
Source: Public Records
Map
Nearby Homes
- 3095 Brombley Dr SE
- 2052 Evergreen Dr SE
- 2791 Wellington Way SE Unit 1
- 3111 Green Gate Way SE
- 2585 Westchester Way SE
- 2561 Old Salem Cir SE
- 2365 Brentmoore Point Unit 3
- 2638 Westchester Pkwy SE
- 1613 Brolington Ct
- 1260 Sweet Shrub Ln SE
- 3226 Old Salem Rd SE
- 3106 Brians Creek Dr SE
- 3205 Haleys Way SE
- 3113 Brians Creek Dr SE
- 2323 Benji Blvd SE
- 2405 Old Salem Rd SE Unit 1
- 3213 Chadwick Ct
- 3217 Chadwick Ct Unit 2
- 0 Chadwick Ct SE Unit 7116272
- 3209 Chadwick Ct Unit 2
- 3212 Chadwick Ct Unit 2
- 3331 Westbury Ct SE Unit 1
- 3221 Chadwick Ct
- 3321 Westbury Ct SE
- 3218 Chadwick Ct Unit 2
- 3208 Chadwick Ct
- 3208 Chadwick Ct Unit 2
- 3205 Chadwick Ct
- 3311 Westbury Ct SE Unit I
- 3204 Chadwick Ct Unit 2
- 3225 Chadwick Ct Unit 71
- 3225 Chadwick Ct
- 3065 Brombley Dr SE
- 3099 Brombley Dr SE
- 3103 Brombley Dr SE
- 3061 Brombley Dr SE