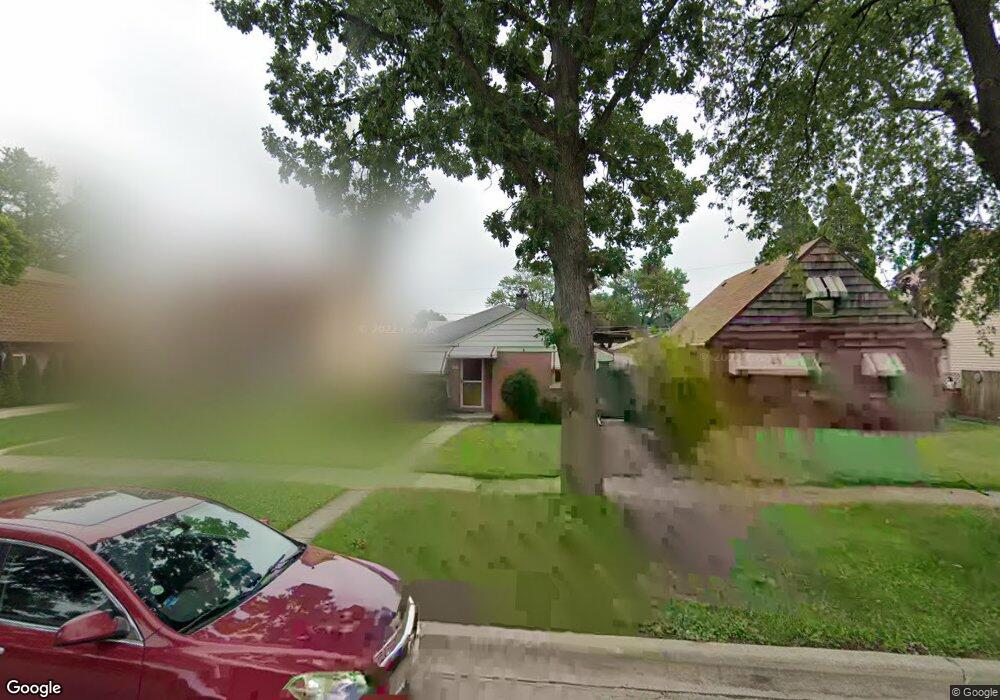
3213 George St Franklin Park, IL 60131
Estimated Value: $283,000 - $304,000
2
Beds
1
Bath
857
Sq Ft
$340/Sq Ft
Est. Value
About This Home
This home is located at 3213 George St, Franklin Park, IL 60131 and is currently estimated at $291,276, approximately $339 per square foot. 3213 George St is a home located in Cook County with nearby schools including Scott Elementary School, Mannheim Middle School, and West Leyden High School.
Ownership History
Date
Name
Owned For
Owner Type
Purchase Details
Closed on
Dec 13, 2001
Sold by
Swider Jane L and Swider Thomas W
Bought by
Holmes Nicholas J and Edwards Kathy V
Current Estimated Value
Home Financials for this Owner
Home Financials are based on the most recent Mortgage that was taken out on this home.
Original Mortgage
$147,885
Outstanding Balance
$59,072
Interest Rate
6.87%
Mortgage Type
FHA
Estimated Equity
$232,204
Purchase Details
Closed on
Jul 14, 1995
Sold by
Perez Daniel and Perez Rosalie M
Bought by
Schultz Jane L
Home Financials for this Owner
Home Financials are based on the most recent Mortgage that was taken out on this home.
Original Mortgage
$87,200
Interest Rate
7%
Purchase Details
Closed on
Mar 6, 1995
Sold by
Perez Rosalie M
Bought by
Perez Daniel and Perez Rosalie M
Create a Home Valuation Report for This Property
The Home Valuation Report is an in-depth analysis detailing your home's value as well as a comparison with similar homes in the area
Home Values in the Area
Average Home Value in this Area
Purchase History
| Date | Buyer | Sale Price | Title Company |
|---|---|---|---|
| Holmes Nicholas J | $150,000 | -- | |
| Schultz Jane L | $109,000 | Attorneys Title Guaranty Fun | |
| Perez Daniel | -- | -- |
Source: Public Records
Mortgage History
| Date | Status | Borrower | Loan Amount |
|---|---|---|---|
| Open | Holmes Nicholas J | $147,885 | |
| Previous Owner | Schultz Jane L | $87,200 |
Source: Public Records
Tax History Compared to Growth
Tax History
| Year | Tax Paid | Tax Assessment Tax Assessment Total Assessment is a certain percentage of the fair market value that is determined by local assessors to be the total taxable value of land and additions on the property. | Land | Improvement |
|---|---|---|---|---|
| 2024 | $5,838 | $21,376 | $4,185 | $17,191 |
| 2023 | $5,715 | $21,376 | $4,185 | $17,191 |
| 2022 | $5,715 | $21,376 | $4,185 | $17,191 |
| 2021 | $4,727 | $15,705 | $3,022 | $12,683 |
| 2020 | $4,774 | $15,705 | $3,022 | $12,683 |
| 2019 | $5,004 | $17,746 | $3,022 | $14,724 |
| 2018 | $4,712 | $15,366 | $2,557 | $12,809 |
| 2017 | $4,711 | $15,366 | $2,557 | $12,809 |
| 2016 | $4,731 | $15,366 | $2,557 | $12,809 |
| 2015 | $4,153 | $13,311 | $2,325 | $10,986 |
| 2014 | $4,092 | $13,311 | $2,325 | $10,986 |
| 2013 | $3,912 | $13,311 | $2,325 | $10,986 |
Source: Public Records
Map
Nearby Homes
- 3046 Sarah St
- 3137 Sunset Ln
- 2920 Sarah St
- 3037 Bright St
- 3516 Dora St
- 3507 Louis St
- 3519 Louis St
- 10542 Crown Rd
- 10548 Crown Rd
- 3421 Elder Ln
- 10245 Mcnerney Dr
- 10345 Mcnerney Dr
- 2843 Hawthorne St
- 3321 Ruby St
- 2749 Scott St
- 2829 Elder Ln
- 10459 Diversey Ave
- 3623 Hawthorne St
- 2807 Elder Ln
- 3652 Hawthorne St