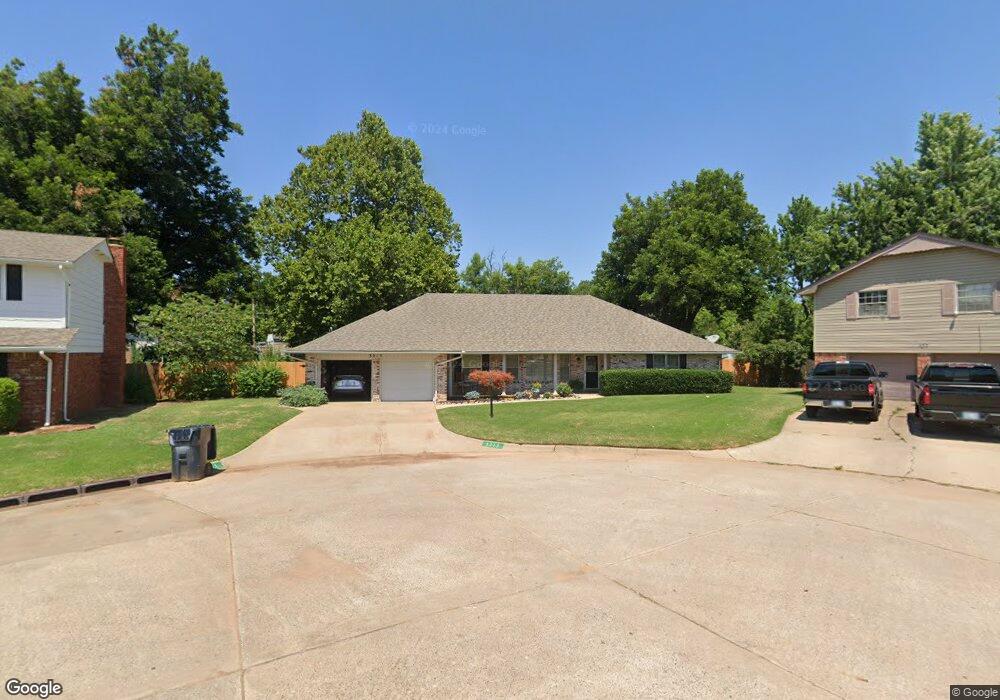
3213 N Meridian Ct Oklahoma City, OK 73122
Windsor Hills NeighborhoodEstimated Value: $279,000 - $315,000
4
Beds
3
Baths
2,655
Sq Ft
$113/Sq Ft
Est. Value
About This Home
This home is located at 3213 N Meridian Ct, Oklahoma City, OK 73122 and is currently estimated at $299,680, approximately $112 per square foot. 3213 N Meridian Ct is a home located in Oklahoma County with nearby schools including Windsor Hills Elementary School, Mayfield Middle School, and Putnam City West High School.
Ownership History
Date
Name
Owned For
Owner Type
Purchase Details
Closed on
Aug 16, 2007
Sold by
Johnson Larry L and Johnson Nancy S
Bought by
Johnson Larry L and Johnson Nancy S Frakes
Current Estimated Value
Purchase Details
Closed on
Dec 10, 2004
Sold by
Johnson Larry L and Johnson Nancy S Frakes
Bought by
Johnson Larry L and Johnson Nancy S
Purchase Details
Closed on
May 25, 2000
Sold by
Orange Bobby R and Orange Ila J
Bought by
Rabish Michael B
Home Financials for this Owner
Home Financials are based on the most recent Mortgage that was taken out on this home.
Original Mortgage
$95,000
Outstanding Balance
$30,120
Interest Rate
7%
Estimated Equity
$269,560
Purchase Details
Closed on
May 22, 2000
Sold by
Myers Carol and Carol Myers Trust
Bought by
Johnson Larry L and Johnson Nancy S Franks
Home Financials for this Owner
Home Financials are based on the most recent Mortgage that was taken out on this home.
Original Mortgage
$95,000
Outstanding Balance
$30,120
Interest Rate
7%
Estimated Equity
$269,560
Create a Home Valuation Report for This Property
The Home Valuation Report is an in-depth analysis detailing your home's value as well as a comparison with similar homes in the area
Home Values in the Area
Average Home Value in this Area
Purchase History
| Date | Buyer | Sale Price | Title Company |
|---|---|---|---|
| Johnson Larry L | -- | Stewart Abstract & Title Of | |
| Johnson Larry L | -- | -- | |
| Rabish Michael B | $50,000 | Capitol Abstract & Title Co | |
| Johnson Larry L | $135,000 | Capitol Abstract & Title Co |
Source: Public Records
Mortgage History
| Date | Status | Borrower | Loan Amount |
|---|---|---|---|
| Open | Johnson Larry L | $95,000 |
Source: Public Records
Tax History Compared to Growth
Tax History
| Year | Tax Paid | Tax Assessment Tax Assessment Total Assessment is a certain percentage of the fair market value that is determined by local assessors to be the total taxable value of land and additions on the property. | Land | Improvement |
|---|---|---|---|---|
| 2024 | $2,683 | $23,699 | $5,197 | $18,502 |
| 2023 | $2,683 | $23,009 | $2,927 | $20,082 |
| 2022 | $2,633 | $22,338 | $3,217 | $19,121 |
| 2021 | $2,529 | $21,688 | $3,576 | $18,112 |
| 2020 | $2,441 | $21,057 | $3,734 | $17,323 |
| 2019 | $2,331 | $20,444 | $3,239 | $17,205 |
| 2018 | $2,262 | $19,849 | $0 | $0 |
| 2017 | $2,197 | $19,270 | $3,229 | $16,041 |
| 2016 | $2,126 | $18,709 | $3,299 | $15,410 |
| 2015 | $2,085 | $18,164 | $3,477 | $14,687 |
| 2014 | $1,944 | $17,635 | $3,481 | $14,154 |
Source: Public Records
Map
Nearby Homes
- 4612 NW 33rd Terrace
- 4612 NW 33rd Dr
- 4608 NW 34th St
- 4621 NW 34th St
- 2800 N Meridian Ct
- 2805 Tudor Rd
- 3508 N Ann Arbor Place
- 2900 N Windsor Blvd
- 4900 NW 34th St
- 2704 N Harvard Ave
- 4504 NW 26th St Unit 4504-4506
- 3823 N Harvard Ave Unit 12
- 4908 NW 32nd St
- 4901 NW 34th St
- 4517 NW 25th Place
- 2613 N Windsor Place
- 2924 N Vermont Ave
- 4838 NW 26th St
- 4113 Mason Dr
- 3608 N Utah Ave
- 4517 NW 32nd St
- 3209 N Meridian Ct
- 3212 Windsor Terrace
- 3216 Windsor Terrace
- 4520 NW 32nd Place
- 3208 Windsor Terrace
- 4516 NW 32nd Place
- 4520 NW 32nd Place
- 4520 NW 32nd Place Unit 4058233223
- 4513 NW 32nd St
- 3205 N Meridian Ct
- 4524 NW 32nd Place
- 3204 Windsor Terrace
- 4512 NW 32nd Place
- 4512 NW 32nd St
- 4509 NW 32nd St
- 3201 N Meridian Ct
- 4528 NW 32nd Place
- 3200 Windsor Terrace
- 4508 NW 32nd Place