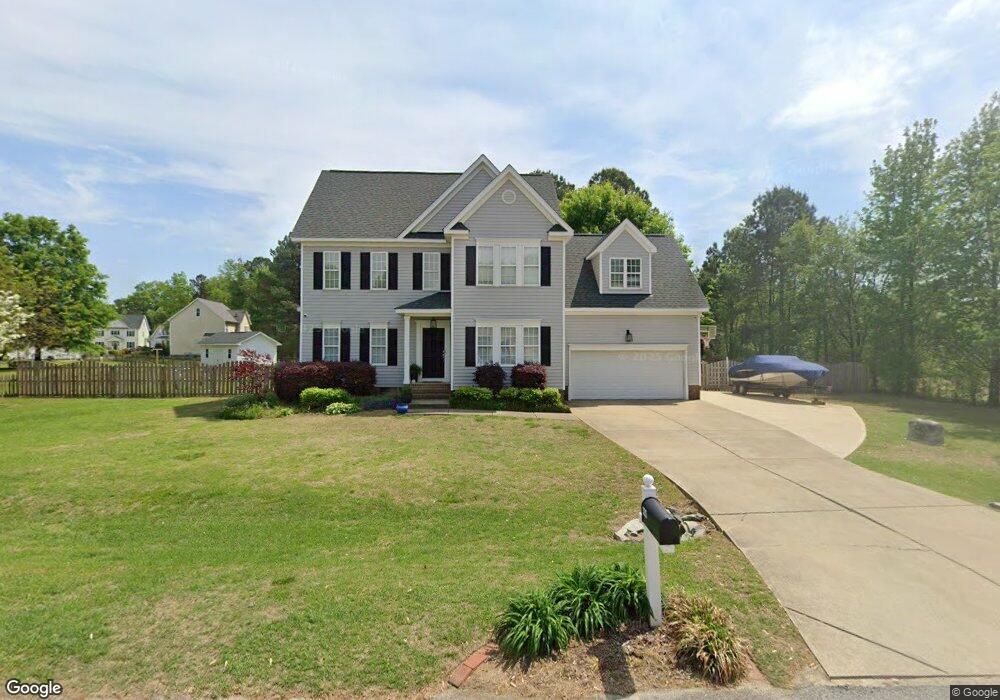
3213 Wilbon Ridge Dr Holly Springs, NC 27540
Estimated Value: $499,000 - $528,371
3
Beds
3
Baths
2,173
Sq Ft
$236/Sq Ft
Est. Value
About This Home
This home is located at 3213 Wilbon Ridge Dr, Holly Springs, NC 27540 and is currently estimated at $512,593, approximately $235 per square foot. 3213 Wilbon Ridge Dr is a home located in Wake County with nearby schools including Buckhorn Creek Elementary, Holly Grove Middle School, and Fuquay-Varina High.
Ownership History
Date
Name
Owned For
Owner Type
Purchase Details
Closed on
Jan 29, 2015
Sold by
George Mary Eileen and George Roger Franklin
Bought by
Bumgarner Jonathan L and Bumgarner Brittany N
Current Estimated Value
Home Financials for this Owner
Home Financials are based on the most recent Mortgage that was taken out on this home.
Original Mortgage
$229,489
Outstanding Balance
$176,932
Interest Rate
3.94%
Mortgage Type
New Conventional
Estimated Equity
$335,661
Purchase Details
Closed on
Sep 23, 2004
Sold by
Ward Daryl E and Ward Kimberly
Bought by
George M Eileen
Home Financials for this Owner
Home Financials are based on the most recent Mortgage that was taken out on this home.
Original Mortgage
$156,400
Interest Rate
5.78%
Mortgage Type
Purchase Money Mortgage
Create a Home Valuation Report for This Property
The Home Valuation Report is an in-depth analysis detailing your home's value as well as a comparison with similar homes in the area
Home Values in the Area
Average Home Value in this Area
Purchase History
| Date | Buyer | Sale Price | Title Company |
|---|---|---|---|
| Bumgarner Jonathan L | $225,000 | None Available | |
| George M Eileen | $195,500 | -- |
Source: Public Records
Mortgage History
| Date | Status | Borrower | Loan Amount |
|---|---|---|---|
| Open | Bumgarner Jonathan L | $229,489 | |
| Previous Owner | George M Eileen | $156,400 | |
| Closed | George M Eileen | $39,100 |
Source: Public Records
Tax History Compared to Growth
Tax History
| Year | Tax Paid | Tax Assessment Tax Assessment Total Assessment is a certain percentage of the fair market value that is determined by local assessors to be the total taxable value of land and additions on the property. | Land | Improvement |
|---|---|---|---|---|
| 2025 | $3,115 | $483,882 | $125,000 | $358,882 |
| 2024 | $3,025 | $483,882 | $125,000 | $358,882 |
| 2023 | $2,295 | $291,764 | $55,000 | $236,764 |
| 2022 | $2,127 | $291,764 | $55,000 | $236,764 |
| 2021 | $1,965 | $276,751 | $55,000 | $221,751 |
| 2020 | $1,932 | $276,751 | $55,000 | $221,751 |
| 2019 | $1,822 | $220,584 | $50,000 | $170,584 |
| 2018 | $1,675 | $220,584 | $50,000 | $170,584 |
| 2017 | $1,588 | $220,584 | $50,000 | $170,584 |
| 2016 | $1,556 | $220,584 | $50,000 | $170,584 |
| 2015 | $1,683 | $239,430 | $54,000 | $185,430 |
| 2014 | $1,595 | $239,430 | $54,000 | $185,430 |
Source: Public Records
Map
Nearby Homes
- 7124 Asheway Dr
- 1313&1317 Wilbon Rd
- 6625 Maggiewood Ln
- 7309 Rouse Rd
- 5824 Adcock Rd
- 1421 Hopson Downs Ct
- 7212 Waltridge Place
- 909 Wilbon Rd
- 605 Hampton Crest Ct
- 608 Ressler St
- 0 Commission Dr
- 0 Piney Grove Wilbon Rd Unit 10115196
- 1528 Maelyn Way
- 975 Wilbon
- 6215 Hilbert Ridge Dr
- 545 Glenwyck Ct
- Cooper Plan at Broadwell Trace - Broadwell Estates
- Cypress Plan at Broadwell Trace - Broadwell Estates
- 0 Buckhorn Duncan Rd Unit 649042
- 809 Briar Gate Dr
- 6505 Sarrucca Ct
- 6509 Sarrucca Ct
- 3212 Wilbon Ridge Dr
- 3216 Wilbon Ridge Dr
- 6409 Sarrucca Ct
- 7428 Rouse Rd
- 6504 Sarrucca Ct
- 6412 Sarrucca Ct
- 6500 Sarrucca Ct
- 6401 Sarrucca Ct
- 6408 Sarrucca Ct
- 6404 Sarrucca Ct
- 6400 Sarrucca Ct
- 7420 Rouse Rd
- 3133 Wilbon Ridge Dr
- 3136 Wilbon Ridge Dr
- 3129 Wilbon Ridge Dr
- 3132 Wilbon Ridge Dr
- 7429 Rouse Rd
- 3128 Wilbon Ridge Dr