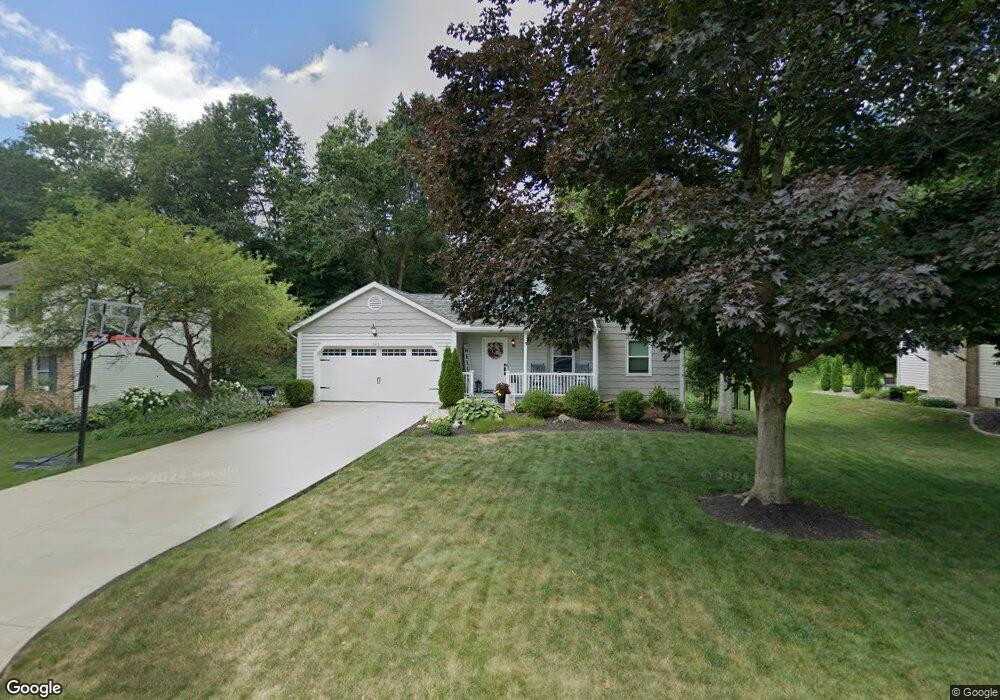
3215 Dunmore Ave NW Canton, OH 44708
Estimated Value: $269,000 - $297,000
3
Beds
3
Baths
1,584
Sq Ft
$178/Sq Ft
Est. Value
About This Home
This home is located at 3215 Dunmore Ave NW, Canton, OH 44708 and is currently estimated at $281,175, approximately $177 per square foot. 3215 Dunmore Ave NW is a home located in Stark County with nearby schools including Amherst Elementary School, Jackson Memorial Middle School, and Jackson High School.
Ownership History
Date
Name
Owned For
Owner Type
Purchase Details
Closed on
Sep 13, 2019
Sold by
Burch Nicholas Carl and Burch Sandra Mckimmie
Bought by
Smith Jessica A and Parker Kelly L
Current Estimated Value
Home Financials for this Owner
Home Financials are based on the most recent Mortgage that was taken out on this home.
Original Mortgage
$144,000
Outstanding Balance
$126,390
Interest Rate
3.7%
Mortgage Type
New Conventional
Estimated Equity
$154,785
Purchase Details
Closed on
Nov 28, 2011
Sold by
Secretary Of Housing & Urban Development
Bought by
Burch Nicholas Carl
Purchase Details
Closed on
Sep 16, 2011
Sold by
Citimortgage Inc
Bought by
Secretary Of Housing & Urban Development
Purchase Details
Closed on
Jun 10, 2011
Sold by
Johnson Kimberly J
Bought by
Citimortgage Inc
Purchase Details
Closed on
Dec 5, 2008
Sold by
Bauhof Ned F
Bought by
Johnson Kimberly J
Home Financials for this Owner
Home Financials are based on the most recent Mortgage that was taken out on this home.
Original Mortgage
$137,255
Interest Rate
6.04%
Mortgage Type
FHA
Purchase Details
Closed on
Jun 6, 2007
Sold by
Bauhof Ned F and Bauhof Judith S
Bought by
Bauhof Ned F and Bauhof Family Trust
Home Financials for this Owner
Home Financials are based on the most recent Mortgage that was taken out on this home.
Original Mortgage
$121,600
Interest Rate
6.21%
Mortgage Type
Purchase Money Mortgage
Purchase Details
Closed on
May 10, 2007
Sold by
Dnf Trust I
Bought by
Ference David M and Ference Nancy F
Home Financials for this Owner
Home Financials are based on the most recent Mortgage that was taken out on this home.
Original Mortgage
$121,600
Interest Rate
6.21%
Mortgage Type
Purchase Money Mortgage
Purchase Details
Closed on
Sep 15, 2003
Sold by
Ference David M and Ference Nancy F
Bought by
Ference David Mark and Ference Nancy Faye
Home Financials for this Owner
Home Financials are based on the most recent Mortgage that was taken out on this home.
Original Mortgage
$500,000
Interest Rate
6.42%
Mortgage Type
Stand Alone Refi Refinance Of Original Loan
Purchase Details
Closed on
Jun 9, 2003
Sold by
Hanke Michael E and Hanke Marilyn E
Bought by
Ference David M and Ference Nancy F
Home Financials for this Owner
Home Financials are based on the most recent Mortgage that was taken out on this home.
Original Mortgage
$100,000
Interest Rate
5.78%
Mortgage Type
Purchase Money Mortgage
Create a Home Valuation Report for This Property
The Home Valuation Report is an in-depth analysis detailing your home's value as well as a comparison with similar homes in the area
Home Values in the Area
Average Home Value in this Area
Purchase History
| Date | Buyer | Sale Price | Title Company |
|---|---|---|---|
| Smith Jessica A | $180,000 | None Available | |
| Burch Nicholas Carl | $96,000 | Attorney | |
| Secretary Of Housing & Urban Development | -- | None Available | |
| Citimortgage Inc | $94,000 | None Available | |
| Johnson Kimberly J | $138,000 | Quest Title Agency Inc | |
| Bauhof Ned F | -- | Quest Title Agency Inc | |
| Bauhof Ned F | $152,000 | Quest Title Agency Inc | |
| Ference David M | -- | None Available | |
| Ference David Mark | -- | -- | |
| Ference David M | $147,900 | Real Living Title Agency Ltd |
Source: Public Records
Mortgage History
| Date | Status | Borrower | Loan Amount |
|---|---|---|---|
| Open | Smith Jessica A | $144,000 | |
| Previous Owner | Johnson Kimberly J | $137,255 | |
| Previous Owner | Bauhof Ned F | $121,600 | |
| Previous Owner | Ference David Mark | $500,000 | |
| Previous Owner | Ference David M | $100,000 |
Source: Public Records
Tax History Compared to Growth
Tax History
| Year | Tax Paid | Tax Assessment Tax Assessment Total Assessment is a certain percentage of the fair market value that is determined by local assessors to be the total taxable value of land and additions on the property. | Land | Improvement |
|---|---|---|---|---|
| 2025 | -- | $71,790 | $22,790 | $49,000 |
| 2024 | -- | $71,790 | $22,790 | $49,000 |
| 2023 | $2,919 | $58,630 | $18,690 | $39,940 |
| 2022 | $1,453 | $58,630 | $18,690 | $39,940 |
| 2021 | $2,917 | $58,630 | $18,690 | $39,940 |
| 2020 | $2,721 | $50,260 | $16,100 | $34,160 |
| 2019 | $2,688 | $50,260 | $16,100 | $34,160 |
| 2018 | $2,704 | $50,260 | $16,100 | $34,160 |
| 2017 | $2,361 | $41,720 | $12,320 | $29,400 |
| 2016 | $2,377 | $41,720 | $12,320 | $29,400 |
| 2015 | $2,406 | $41,720 | $12,320 | $29,400 |
| 2014 | $410 | $39,940 | $11,800 | $28,140 |
| 2013 | $1,188 | $39,940 | $11,800 | $28,140 |
Source: Public Records
Map
Nearby Homes
- 3051 Blue Ash Ave NW
- 3432 Stillwater Ave NW
- 3436 Cardiff Ave NW
- 3490 Cardiff Ave NW
- 2174 Via Luna Cir NE Unit 15
- 2172 Via Luna Cir NE Unit 16
- 3151 Perry Dr NW
- 2984 Villa Glen Cir NW
- 2889 Vicksburg Ave NW
- 2873 Olympia Dr NW
- 3591 Harris Ave NW
- 6487 - 6523 Hills And Dales Rd NW
- Lot 33 Joyce Ave NW
- 3430 Joyce Ave NW
- Lot 38 Joyce Ave NW
- 3452 Joyce Ave NW
- Aviano Plan at Aberdeen Oaks
- Hudson Plan at Aberdeen Oaks
- Allegheny Plan at Aberdeen Oaks
- Columbia Plan at Aberdeen Oaks
- 3233 Dunmore Ave NW
- 3201 Dunmore Ave NW
- 3251 Dunmore Ave NW
- 3181 Dunmore Ave NW
- 3216 Dunmore Ave NW
- 3232 Dunmore Ave NW
- 3198 Dunmore Ave NW
- 3410 Perry Dr NW
- 3269 Dunmore Ave NW
- 3180 Dunmore Ave NW
- 3286 Stillwater Ave NW
- 3268 Dunmore Ave NW
- 3195 S Billingsgate Cir NW
- 3278 Stillwater Ave NW Unit 22
- 3285 Dunmore Ave NW
- 3235 N Billingsgate Cir NW
- 3294 Stillwater Ave NW
- 3270 Stillwater Ave NW
- 6692 Avalon St NW
- 3126 Blue Ash Ave NW