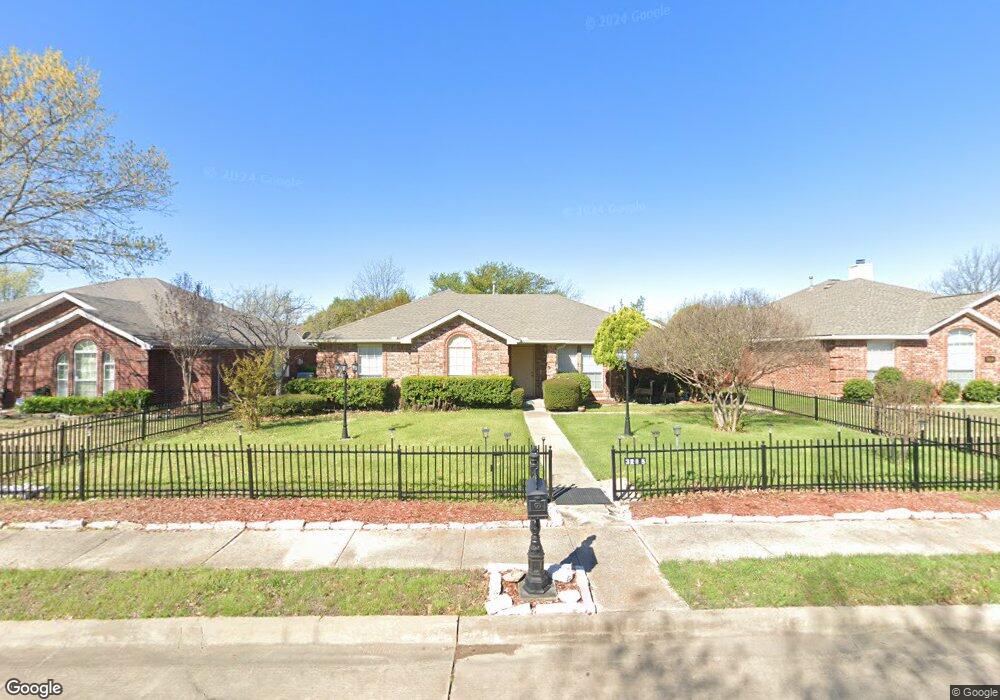
3215 Lance Ln Sachse, TX 75048
Estimated Value: $331,224 - $363,000
3
Beds
2
Baths
1,535
Sq Ft
$225/Sq Ft
Est. Value
About This Home
This home is located at 3215 Lance Ln, Sachse, TX 75048 and is currently estimated at $345,556, approximately $225 per square foot. 3215 Lance Ln is a home located in Collin County with nearby schools including Don Whitt Elementary School, Dr. Al Draper Intermediate Middle School, and Raymond B Cooper J High School.
Ownership History
Date
Name
Owned For
Owner Type
Purchase Details
Closed on
May 22, 1998
Sold by
Hud
Bought by
Kennedy Laura J
Current Estimated Value
Home Financials for this Owner
Home Financials are based on the most recent Mortgage that was taken out on this home.
Original Mortgage
$66,513
Outstanding Balance
$13,132
Interest Rate
7.22%
Mortgage Type
FHA
Estimated Equity
$332,424
Purchase Details
Closed on
Dec 4, 1997
Sold by
Temple Inland Mtg Corp
Bought by
Hud
Purchase Details
Closed on
Dec 2, 1997
Sold by
Gassner John R and Gassner Stephanie M
Bought by
Temple Inland Mtg Corp
Purchase Details
Closed on
Dec 15, 1993
Sold by
Carriage Custom Homes Inc
Bought by
Gassner John R and Gassner Stephanie M
Home Financials for this Owner
Home Financials are based on the most recent Mortgage that was taken out on this home.
Original Mortgage
$83,842
Interest Rate
7.06%
Mortgage Type
FHA
Create a Home Valuation Report for This Property
The Home Valuation Report is an in-depth analysis detailing your home's value as well as a comparison with similar homes in the area
Home Values in the Area
Average Home Value in this Area
Purchase History
| Date | Buyer | Sale Price | Title Company |
|---|---|---|---|
| Kennedy Laura J | $85,051 | -- | |
| Hud | -- | -- | |
| Temple Inland Mtg Corp | $89,415 | -- | |
| Gassner John R | -- | -- |
Source: Public Records
Mortgage History
| Date | Status | Borrower | Loan Amount |
|---|---|---|---|
| Open | Kennedy Laura J | $66,513 | |
| Previous Owner | Gassner John R | $83,842 |
Source: Public Records
Tax History Compared to Growth
Tax History
| Year | Tax Paid | Tax Assessment Tax Assessment Total Assessment is a certain percentage of the fair market value that is determined by local assessors to be the total taxable value of land and additions on the property. | Land | Improvement |
|---|---|---|---|---|
| 2025 | $2,094 | $312,093 | $100,000 | $221,160 |
| 2024 | $2,094 | $283,721 | $100,000 | $238,242 |
| 2023 | $2,094 | $257,928 | $80,000 | $244,125 |
| 2022 | $5,351 | $234,480 | $80,000 | $207,145 |
| 2021 | $5,137 | $226,906 | $55,000 | $171,906 |
| 2020 | $4,873 | $193,785 | $55,000 | $138,785 |
| 2019 | $4,803 | $183,169 | $55,000 | $141,185 |
| 2018 | $4,428 | $166,517 | $55,000 | $131,508 |
| 2017 | $4,026 | $180,778 | $45,000 | $135,778 |
| 2016 | $3,698 | $145,845 | $30,000 | $115,845 |
| 2015 | $2,843 | $130,676 | $30,000 | $100,676 |
Source: Public Records
Map
Nearby Homes
- 6925 Dewitt Rd
- 3206 Creekside Dr
- 2415 Green Meadow Dr
- 7309 Parkwood Dr
- 3117 Tina St
- 3604 Texas Dr
- 2605 Mcdearmon St
- 6315 Sachse St
- 7706 Paddock Trail
- 7307 Crane Dr
- 2321 3rd St
- 2911 Tracy Lynn Ln
- 3521 Meadowside Dr
- 6218 Dewitt St
- 7319 Crane Dr
- 7612 Cindy Ln
- 6905 Wilhelmina Dr
- 7213 Bronco Bluff
- 2011 Cori Place
- 7022 Cottonwood Cir