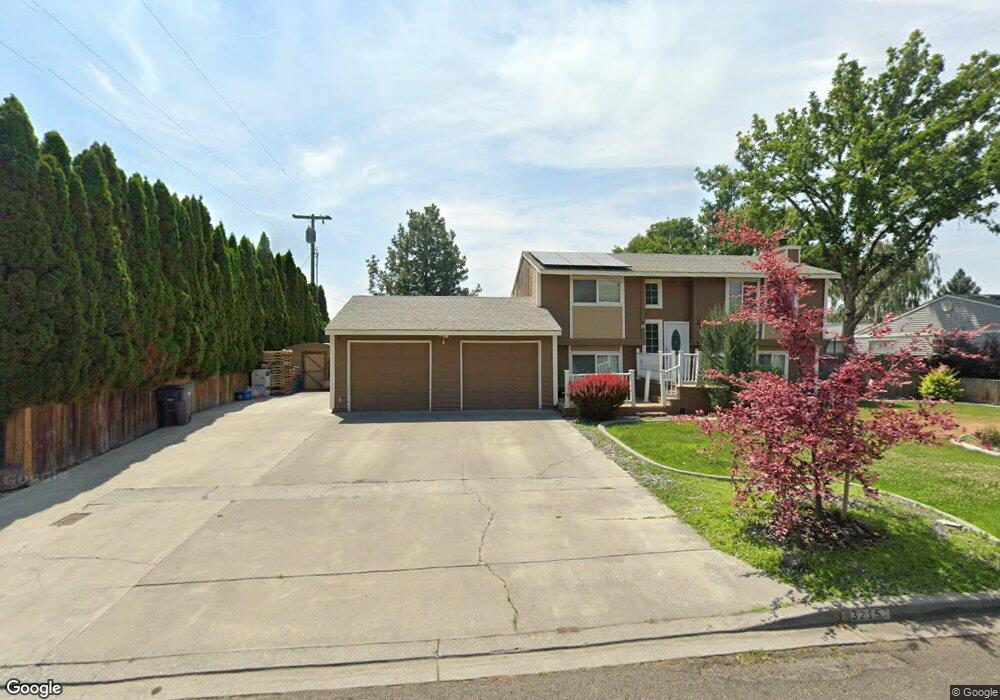
3215 W 13th Ave Kennewick, WA 99338
Estimated Value: $389,362 - $420,000
3
Beds
2
Baths
1,728
Sq Ft
$234/Sq Ft
Est. Value
About This Home
This home is located at 3215 W 13th Ave, Kennewick, WA 99338 and is currently estimated at $404,091, approximately $233 per square foot. 3215 W 13th Ave is a home located in Benton County with nearby schools including Lincoln Elementary School, Southridge High School, and Bethlehem Lutheran School.
Ownership History
Date
Name
Owned For
Owner Type
Purchase Details
Closed on
Mar 17, 2025
Sold by
Llamas Vazquez Andres and Llamas Ibarra Deyanire
Bought by
Vazquez Andres Llamas and Ibarra Deyanire Llamas
Current Estimated Value
Home Financials for this Owner
Home Financials are based on the most recent Mortgage that was taken out on this home.
Original Mortgage
$200,000
Outstanding Balance
$199,202
Interest Rate
8.13%
Mortgage Type
New Conventional
Estimated Equity
$204,889
Purchase Details
Closed on
Oct 15, 2013
Sold by
Decoria Freddie Lee and Decoria Shauna H
Bought by
Vazquez Andres Llamas and Ibarra Deyanire Llamas
Home Financials for this Owner
Home Financials are based on the most recent Mortgage that was taken out on this home.
Original Mortgage
$147,000
Interest Rate
4.55%
Mortgage Type
Seller Take Back
Create a Home Valuation Report for This Property
The Home Valuation Report is an in-depth analysis detailing your home's value as well as a comparison with similar homes in the area
Home Values in the Area
Average Home Value in this Area
Purchase History
| Date | Buyer | Sale Price | Title Company |
|---|---|---|---|
| Vazquez Andres Llamas | $313 | Ticor Title | |
| Vazquez Andres Llamas | $160,000 | Benton Franklin Title Co |
Source: Public Records
Mortgage History
| Date | Status | Borrower | Loan Amount |
|---|---|---|---|
| Open | Vazquez Andres Llamas | $200,000 | |
| Previous Owner | Vazquez Andres Llamas | $147,000 |
Source: Public Records
Tax History Compared to Growth
Tax History
| Year | Tax Paid | Tax Assessment Tax Assessment Total Assessment is a certain percentage of the fair market value that is determined by local assessors to be the total taxable value of land and additions on the property. | Land | Improvement |
|---|---|---|---|---|
| 2024 | $2,488 | $324,260 | $70,000 | $254,260 |
| 2023 | $2,488 | $309,730 | $70,000 | $239,730 |
| 2022 | $2,187 | $244,350 | $70,000 | $174,350 |
| 2021 | $2,048 | $222,560 | $70,000 | $152,560 |
| 2020 | $2,022 | $202,000 | $35,000 | $167,000 |
| 2019 | $1,750 | $190,860 | $35,000 | $155,860 |
| 2018 | $1,855 | $168,600 | $35,000 | $133,600 |
| 2017 | $1,695 | $146,330 | $35,000 | $111,330 |
| 2016 | $2,116 | $146,330 | $35,000 | $111,330 |
| 2015 | $2,254 | $146,330 | $35,000 | $111,330 |
| 2014 | -- | $157,640 | $30,000 | $127,640 |
| 2013 | -- | $157,640 | $30,000 | $127,640 |
Source: Public Records
Map
Nearby Homes
- 3214 W 13th Ave
- 1241 S Keller Place
- 3324 W 19th Ave Unit 186
- 3324 W 19th Ave Unit 14
- 3324 W 19th Ave Unit 57
- 1150 S Keller Place
- 3572 S 11th Place
- 943 S Keller St
- 939 S Keller St
- 3611 W 15th Ave Unit 1-4
- 1716 S Huntington Place
- 1428 S Quillan Ct
- 2906 W 7th Ave Unit 23
- 2906 W 7th Ave Unit 74
- 2917 W 19th Ave Unit 103
- 604 S Huntington Place
- 3416 W 6th Place
- 727 S Conway St
- 3701 W 20th Ave
- 4109 W 18th Ave
- 3223 W 13th Ave
- 1302 S Irby St
- 1316 S Irby St
- 3227 W 13th Ave
- 1208 S Irby St
- 3222 W 13th Ave
- 1207 S Johnson St
- 1301 S Irby St
- 3215 W 12th Ave
- 1202 S Irby St
- 3231 W 13th Ave
- 3223 W 12th Ave
- 1210 S Johnson St
- 1203 S Johnson St
- 1211 S Irby St
- 3324 W 19th Avenue Trlr 109
- 1206 S Johnson St Unit AWESOME HOME, AWESOM
- 1206 S Johnson St Unit MULTIPLE OFFERS-see
- 1206 S Johnson St
- 1203 S Irby St