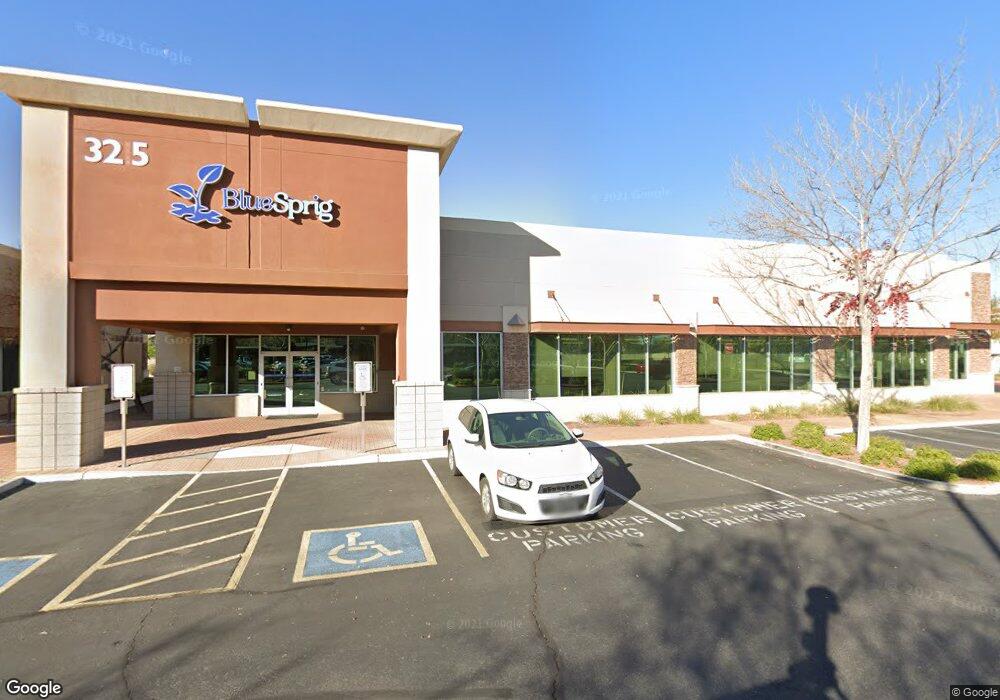
3215 W Ray Rd Chandler, AZ 85226
West Chandler NeighborhoodEstimated Value: $3,107,054
--
Bed
--
Bath
2,000
Sq Ft
$1,554/Sq Ft
Est. Value
About This Home
This home is located at 3215 W Ray Rd, Chandler, AZ 85226 and is currently estimated at $3,107,054, approximately $1,553 per square foot. 3215 W Ray Rd is a home located in Maricopa County with nearby schools including Kyrene Traditional Academy, Kyrene Aprende Middle School, and Corona Del Sol High School.
Ownership History
Date
Name
Owned For
Owner Type
Purchase Details
Closed on
Aug 27, 2020
Sold by
Ssr Capital Group Llc
Bought by
Acosta Farm Properties Lp
Current Estimated Value
Home Financials for this Owner
Home Financials are based on the most recent Mortgage that was taken out on this home.
Original Mortgage
$475,000
Outstanding Balance
$421,531
Interest Rate
2.9%
Mortgage Type
Commercial
Estimated Equity
$2,685,523
Purchase Details
Closed on
Jun 30, 2010
Sold by
Ray Road Investment Company Llc
Bought by
Ssr Capital Group Llc
Home Financials for this Owner
Home Financials are based on the most recent Mortgage that was taken out on this home.
Original Mortgage
$1,282,500
Interest Rate
4.82%
Mortgage Type
Commercial
Purchase Details
Closed on
Jan 26, 2010
Sold by
The Park At San Tan Llc
Bought by
Ray Road Investment Company Llc
Create a Home Valuation Report for This Property
The Home Valuation Report is an in-depth analysis detailing your home's value as well as a comparison with similar homes in the area
Home Values in the Area
Average Home Value in this Area
Purchase History
| Date | Buyer | Sale Price | Title Company |
|---|---|---|---|
| Acosta Farm Properties Lp | $2,200,000 | First American Title Ins Co | |
| Ssr Capital Group Llc | $983,645 | Fidelity National Title | |
| Ray Road Investment Company Llc | $2,862,350 | None Available |
Source: Public Records
Mortgage History
| Date | Status | Borrower | Loan Amount |
|---|---|---|---|
| Open | Acosta Farm Properties Lp | $475,000 | |
| Previous Owner | Ssr Capital Group Llc | $1,282,500 |
Source: Public Records
Tax History Compared to Growth
Tax History
| Year | Tax Paid | Tax Assessment Tax Assessment Total Assessment is a certain percentage of the fair market value that is determined by local assessors to be the total taxable value of land and additions on the property. | Land | Improvement |
|---|---|---|---|---|
| 2025 | $12,644 | $132,722 | -- | -- |
| 2024 | $12,861 | $130,352 | -- | -- |
| 2023 | $12,861 | $267,835 | $53,567 | $214,268 |
| 2022 | $12,676 | $228,813 | $45,763 | $183,050 |
| 2021 | $13,471 | $229,518 | $45,900 | $183,618 |
| 2020 | $13,186 | $218,016 | $43,596 | $174,420 |
| 2019 | $12,824 | $185,886 | $37,170 | $148,716 |
| 2018 | $12,446 | $162,648 | $32,526 | $130,122 |
| 2017 | $11,912 | $145,404 | $29,070 | $116,334 |
| 2016 | $12,078 | $150,138 | $30,024 | $120,114 |
| 2015 | $11,436 | $130,537 | $26,104 | $104,433 |
Source: Public Records
Map
Nearby Homes
- 991 N Florence Dr
- 782 N Sicily Dr
- 3424 W Thude Dr
- 3580 W Dublin St
- 3111 W Baylor Ln
- 3165 W Golden Ln
- 3382 W Monterey St
- 3683 W Barcelona Dr
- 2784 W Del Rio Place
- 526 N Criss St
- 3833 W Ivanhoe St
- 527 N Pepperwood Ct Unit 3
- 3947 W Roundabout Cir
- 2623 W Ivanhoe St
- 2571 W Park Ave
- 2580 W Shannon Ct
- 2173 E La Vieve Ln
- 2541 W Park Ave
- 3930 W Monterey St Unit 108
- 3513 W Carla Vista Dr
- 3241 W Ross Dr
- 3251 W Ross Dr
- 3260 W Shannon Place
- 941 N Florence Dr
- 3261 W Ross Dr
- 951 N Florence Dr
- 3251 W Shannon Place
- 3270 W Shannon Place
- 3195 W Ray Rd
- 961 N Florence Dr
- 3271 W Ross Dr Unit 1
- 3280 W Shannon Place
- 3261 W Shannon Place
- 3281 W Ross Dr
- 3272 W Ross Dr
- 3210 W Harrison St
- 3290 W Shannon Place
- 981 N Florence Dr
- 3282 W Ross Dr
- 3291 W Ross Dr