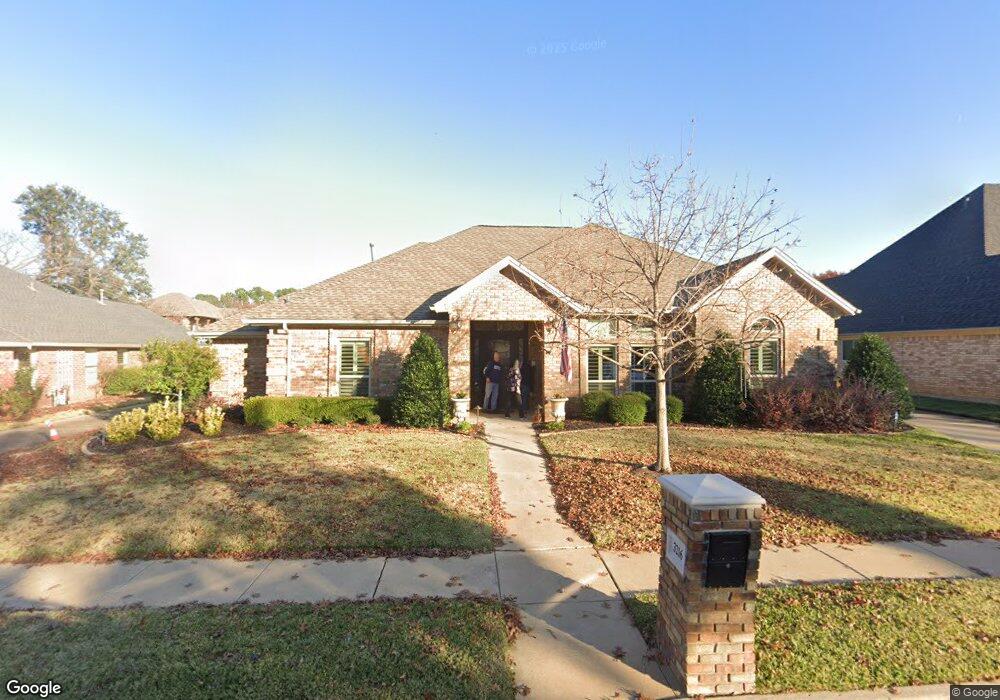
3216 Ashland Dr Bedford, TX 76021
Estimated Value: $558,000 - $591,000
4
Beds
3
Baths
2,537
Sq Ft
$228/Sq Ft
Est. Value
About This Home
This home is located at 3216 Ashland Dr, Bedford, TX 76021 and is currently estimated at $577,503, approximately $227 per square foot. 3216 Ashland Dr is a home located in Tarrant County with nearby schools including Bedford Heights Elementary School, Bedford Junior High School, and L.D. Bell High School.
Ownership History
Date
Name
Owned For
Owner Type
Purchase Details
Closed on
May 15, 2020
Sold by
Kowalski Stanley Louis and Wilemon Kathryn Ann
Bought by
Wilemon Kathryn Ann and The Wilemon Kowalski Living Tr
Current Estimated Value
Purchase Details
Closed on
Apr 28, 2006
Sold by
Weichert Relocation Resources Inc
Bought by
Lowalski Stanley L and Wilemon Kathy A
Home Financials for this Owner
Home Financials are based on the most recent Mortgage that was taken out on this home.
Original Mortgage
$102,900
Interest Rate
5.62%
Mortgage Type
Fannie Mae Freddie Mac
Purchase Details
Closed on
Mar 28, 2006
Sold by
Fader Ralph P and Fader Elizabeth A
Bought by
Weichert Relocation Resources Inc
Home Financials for this Owner
Home Financials are based on the most recent Mortgage that was taken out on this home.
Original Mortgage
$102,900
Interest Rate
5.62%
Mortgage Type
Fannie Mae Freddie Mac
Create a Home Valuation Report for This Property
The Home Valuation Report is an in-depth analysis detailing your home's value as well as a comparison with similar homes in the area
Home Values in the Area
Average Home Value in this Area
Purchase History
| Date | Buyer | Sale Price | Title Company |
|---|---|---|---|
| Wilemon Kathryn Ann | -- | None Available | |
| Lowalski Stanley L | -- | Alamo Title Company | |
| Weichert Relocation Resources Inc | -- | Alamo Title Company |
Source: Public Records
Mortgage History
| Date | Status | Borrower | Loan Amount |
|---|---|---|---|
| Closed | Lowalski Stanley L | $102,900 |
Source: Public Records
Tax History Compared to Growth
Tax History
| Year | Tax Paid | Tax Assessment Tax Assessment Total Assessment is a certain percentage of the fair market value that is determined by local assessors to be the total taxable value of land and additions on the property. | Land | Improvement |
|---|---|---|---|---|
| 2025 | $3,718 | $550,567 | $130,000 | $420,567 |
| 2024 | $3,718 | $550,567 | $130,000 | $420,567 |
| 2023 | $8,359 | $558,000 | $80,000 | $478,000 |
| 2022 | $8,653 | $412,000 | $80,000 | $332,000 |
| 2021 | $8,484 | $412,000 | $80,000 | $332,000 |
| 2020 | $7,785 | $352,000 | $80,000 | $272,000 |
| 2019 | $7,231 | $352,000 | $80,000 | $272,000 |
| 2018 | $6,192 | $270,600 | $80,000 | $190,600 |
| 2017 | $5,951 | $246,000 | $30,000 | $216,000 |
| 2016 | $5,879 | $243,031 | $30,000 | $213,031 |
| 2015 | $5,895 | $235,872 | $30,000 | $205,872 |
| 2014 | $5,895 | $245,700 | $30,000 | $215,700 |
Source: Public Records
Map
Nearby Homes
- 1209 Hillandale Ct
- 3301 Wendover Ct
- 1636 Bedford Oaks Dr
- 1800 Hampton Dr
- 1704 Indian Oaks Ct
- 1401 Danielle Dr
- 1109 Simpson Terrace
- 2901 Miles Way
- 1136 Wingate Dr
- 1820 Wimbleton Dr
- 3827 Ashbury Ln
- 1630 Post Oak Dr
- 1723 Post Oak Dr
- 37 Devonshire Dr
- 3532 Meadowside Dr
- 913 Kensington Ct
- 3513 Meadowside Dr
- 3624 Wayne Ct
- 3609 Wayne Ct
- 2704 Shady Grove Dr
- 3212 Ashland Dr
- 3220 Ashland Dr
- 3217 Channing Ln
- 3213 Channing Ln
- 3208 Ashland Dr
- 3221 Channing Ln
- 3224 Ashland Dr
- 3217 Ashland Dr
- 3209 Channing Ln
- 3213 Ashland Dr
- 3221 Ashland Dr
- 3225 Channing Ln
- 3209 Ashland Dr
- 3204 Ashland Dr
- 3225 Ashland Dr
- 3228 Ashland Dr
- 3205 Channing Ln
- 3220 Creighton Ln
- 3216 Channing Ln
- 3205 Ashland Dr