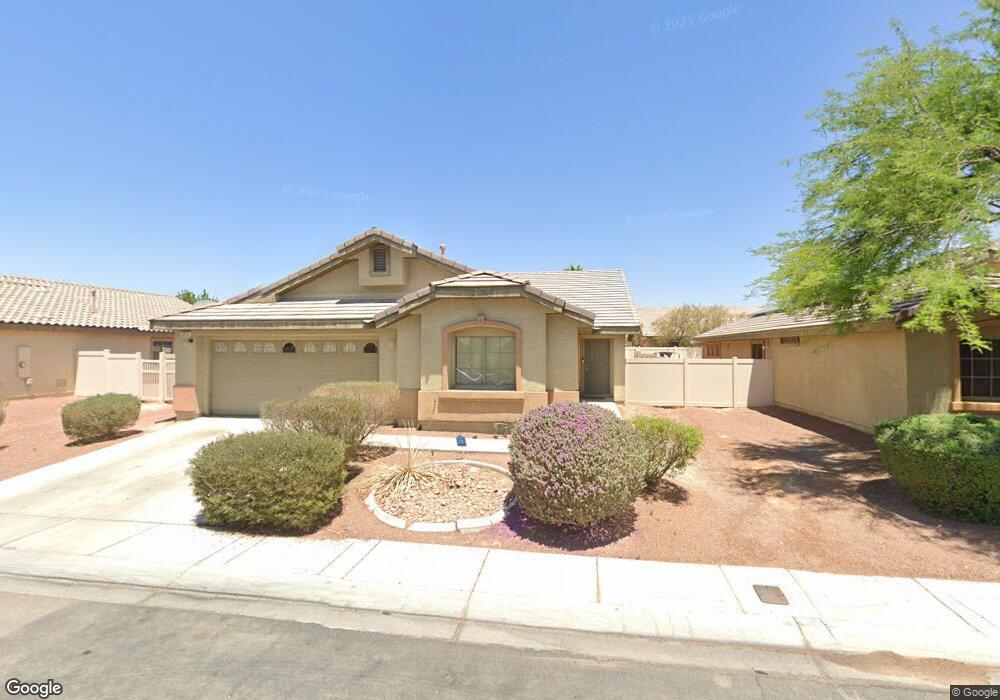
3216 Copper Sunset Ave Unit 2A North Las Vegas, NV 89081
Northridge NeighborhoodEstimated Value: $415,081 - $444,000
5
Beds
2
Baths
1,952
Sq Ft
$223/Sq Ft
Est. Value
About This Home
This home is located at 3216 Copper Sunset Ave Unit 2A, North Las Vegas, NV 89081 and is currently estimated at $434,520, approximately $222 per square foot. 3216 Copper Sunset Ave Unit 2A is a home located in Clark County with nearby schools including John Tartan Elementary School, Clifford O. Findlay Middle School, and Mojave High School.
Ownership History
Date
Name
Owned For
Owner Type
Purchase Details
Closed on
Aug 12, 2011
Sold by
Partush Shlomo
Bought by
Snemep Llc
Current Estimated Value
Purchase Details
Closed on
Jun 28, 2011
Sold by
The Bank Of New York Mellon
Bought by
Partush Shlomo
Purchase Details
Closed on
Apr 26, 2011
Sold by
Squires Joann Lyn and Squires Gregory J
Bought by
The Bank Of New York Mellon and The Bank Of New York
Purchase Details
Closed on
Jul 26, 2005
Sold by
Centex Homes
Bought by
Squires Gregory J and Squires Joann Lyn
Home Financials for this Owner
Home Financials are based on the most recent Mortgage that was taken out on this home.
Original Mortgage
$291,600
Interest Rate
2%
Create a Home Valuation Report for This Property
The Home Valuation Report is an in-depth analysis detailing your home's value as well as a comparison with similar homes in the area
Home Values in the Area
Average Home Value in this Area
Purchase History
| Date | Buyer | Sale Price | Title Company |
|---|---|---|---|
| Snemep Llc | -- | None Available | |
| Partush Shlomo | $107,500 | Fidelity Rainbow | |
| The Bank Of New York Mellon | $102,600 | Pasion Title Services | |
| Squires Gregory J | $324,003 | Commerce Title |
Source: Public Records
Mortgage History
| Date | Status | Borrower | Loan Amount |
|---|---|---|---|
| Previous Owner | Squires Gregory J | $291,600 |
Source: Public Records
Tax History Compared to Growth
Tax History
| Year | Tax Paid | Tax Assessment Tax Assessment Total Assessment is a certain percentage of the fair market value that is determined by local assessors to be the total taxable value of land and additions on the property. | Land | Improvement |
|---|---|---|---|---|
| 2025 | $2,344 | $126,693 | $34,300 | $92,393 |
| 2024 | $2,171 | $126,693 | $34,300 | $92,393 |
| 2023 | $2,171 | $120,331 | $33,250 | $87,081 |
| 2022 | $2,010 | $105,928 | $26,250 | $79,678 |
| 2021 | $1,862 | $99,759 | $24,150 | $75,609 |
| 2020 | $1,726 | $99,099 | $24,150 | $74,949 |
| 2019 | $1,617 | $93,790 | $20,300 | $73,490 |
| 2018 | $1,543 | $75,105 | $15,750 | $59,355 |
| 2017 | $2,291 | $68,312 | $14,700 | $53,612 |
| 2016 | $1,445 | $59,057 | $11,550 | $47,507 |
| 2015 | $1,442 | $52,748 | $8,750 | $43,998 |
| 2014 | $1,397 | $40,403 | $5,950 | $34,453 |
Source: Public Records
Map
Nearby Homes
- 5828 Autumn Damask St
- 3405 Brook Song Ave
- 3112 Blush Noisette Ave
- 3032 Prairie Princess Ave
- 3156 Mclennan Ave
- 3425 Palatine Hills Ave
- 6040 Eganridge Ct
- 5745 Sagamore Canyon St
- 5913 Saratoga Reserve St
- 5733 Awakening St
- 5650 Pleasant Palms St
- 3112 Winter Sunset Ave
- 5721 Keystone Crest St
- 5654 Sagamore Canyon St
- 3217 Aspinwall Ct
- 5629 Sagamore Canyon St
- 3208 Aspinwall Ct
- 5805 Hannah Brook St
- 3605 Greenbriar Bluff Ave
- 2916 Kildare Cove Ct
- 3220 Copper Sunset Ave
- 3212 Copper Sunset Ave
- 3225 Black Jade Ave
- 3221 Black Jade Ave
- 3229 Black Jade Ave
- 3208 Copper Sunset Ave
- 3224 Copper Sunset Ave
- 3221 Copper Sunset Ave
- 3217 Copper Sunset Ave
- 3217 Black Jade Ave Unit 2C
- 3233 Black Jade Ave Unit 2C
- 3225 Copper Sunset Ave
- 3213 Copper Sunset Ave
- 3204 Copper Sunset Ave
- 3229 Copper Sunset Ave
- 3209 Copper Sunset Ave
- 3213 Black Jade Ave
- 3224 Black Jade Ave
- 3220 Denvers Dream Ave
- 3216 Denvers Dream Ave