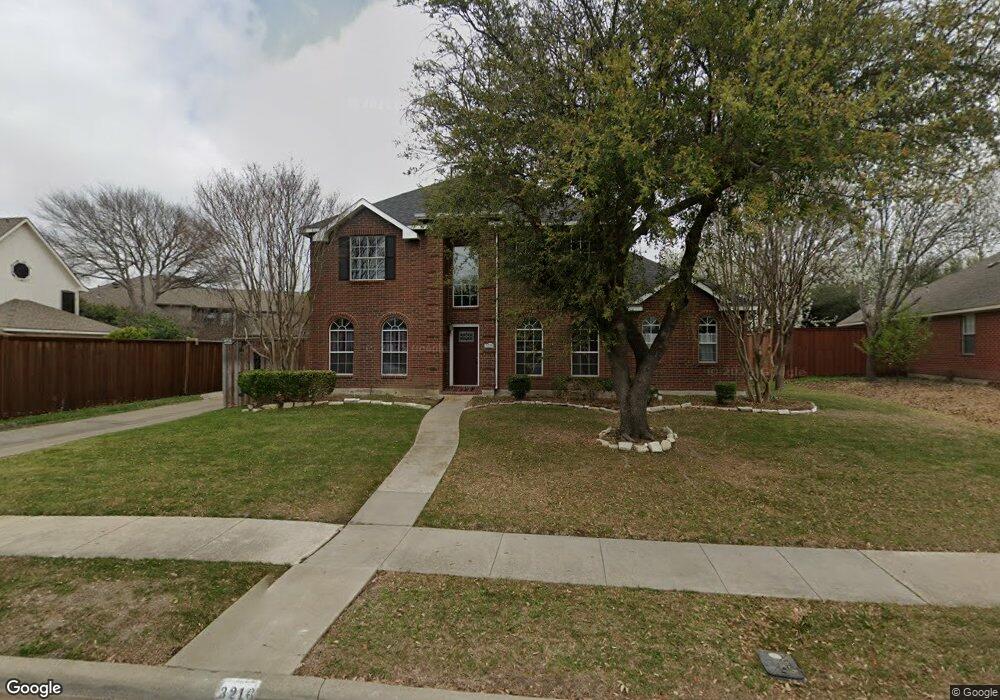
3216 Grantham Dr Richardson, TX 75082
Breckinridge NeighborhoodEstimated Value: $538,000 - $572,000
4
Beds
3
Baths
2,789
Sq Ft
$197/Sq Ft
Est. Value
About This Home
This home is located at 3216 Grantham Dr, Richardson, TX 75082 and is currently estimated at $550,722, approximately $197 per square foot. 3216 Grantham Dr is a home located in Collin County with nearby schools including Miller Elementary School, Murphy Middle School, and C A Mcmillen High School.
Ownership History
Date
Name
Owned For
Owner Type
Purchase Details
Closed on
Nov 13, 2009
Sold by
Frick Brandelynn Rader
Bought by
Frick John Michael
Current Estimated Value
Home Financials for this Owner
Home Financials are based on the most recent Mortgage that was taken out on this home.
Original Mortgage
$40,000
Outstanding Balance
$25,958
Interest Rate
4.88%
Mortgage Type
Seller Take Back
Estimated Equity
$524,764
Purchase Details
Closed on
Aug 29, 1997
Sold by
Albrecht Edward and Albrecht Theresa Kathryn
Bought by
Frick John M
Home Financials for this Owner
Home Financials are based on the most recent Mortgage that was taken out on this home.
Original Mortgage
$128,800
Outstanding Balance
$19,890
Interest Rate
7.43%
Estimated Equity
$530,832
Purchase Details
Closed on
Jul 31, 1995
Sold by
Centex Real Estate Corp
Bought by
Albrecht Frank Edward and Albrecht Theresa Kathryn
Home Financials for this Owner
Home Financials are based on the most recent Mortgage that was taken out on this home.
Original Mortgage
$128,550
Interest Rate
7.51%
Create a Home Valuation Report for This Property
The Home Valuation Report is an in-depth analysis detailing your home's value as well as a comparison with similar homes in the area
Home Values in the Area
Average Home Value in this Area
Purchase History
| Date | Buyer | Sale Price | Title Company |
|---|---|---|---|
| Frick John Michael | -- | None Available | |
| Frick Brandelynn Rader | -- | None Available | |
| Frick John M | -- | -- | |
| Albrecht Frank Edward | -- | -- |
Source: Public Records
Mortgage History
| Date | Status | Borrower | Loan Amount |
|---|---|---|---|
| Open | Frick John Michael | $40,000 | |
| Open | Frick John M | $128,800 | |
| Previous Owner | Albrecht Frank Edward | $128,550 |
Source: Public Records
Tax History
| Year | Tax Paid | Tax Assessment Tax Assessment Total Assessment is a certain percentage of the fair market value that is determined by local assessors to be the total taxable value of land and additions on the property. | Land | Improvement |
|---|---|---|---|---|
| 2025 | $7,515 | $526,045 | $155,250 | $371,356 |
| 2024 | $7,515 | $478,223 | $129,375 | $390,191 |
| 2023 | $7,515 | $434,748 | $129,375 | $378,643 |
| 2022 | $8,119 | $395,225 | $124,200 | $334,092 |
| 2021 | $7,851 | $359,295 | $93,150 | $266,145 |
| 2020 | $7,652 | $344,870 | $82,800 | $262,070 |
| 2019 | $7,916 | $340,310 | $82,800 | $257,510 |
| 2018 | $7,806 | $334,145 | $82,800 | $251,345 |
| 2017 | $7,178 | $307,241 | $72,450 | $234,791 |
| 2016 | $6,585 | $290,959 | $62,100 | $228,859 |
| 2015 | $5,304 | $259,795 | $62,100 | $197,695 |
Source: Public Records
Map
Nearby Homes
- 3207 Abingdon Dr
- 5811 Abingdon Dr
- 108 Starlite Dr
- 155 Sunset Dr
- 3104 Stonehenge Dr
- 524 Jasmine Dr
- 3041 Hillingdon Dr
- 403 Pleasant Run
- 412 Skyline Dr
- 3805 Wellington Dr
- 316 Mimosa Dr
- 428 Rainforest Ct
- 1008 Yarnell Place
- 202 Sweetgum Dr
- 333 Green Acres Dr
- 505 Horizon Ct
- 432 Pleasant Run
- 1150 Dove Tail Ct
- 18 Kilchurn
- 300 Shady Timbers Ln
- 3214 Grantham Dr
- 5804 Grantham Ct
- 5802 Grantham Ct
- 3212 Grantham Dr
- 3215 Grantham Dr
- 3213 Grantham Dr
- 5806 Grantham Ct
- 3210 Grantham Dr
- 3301 Grantham Dr
- 3211 Grantham Dr
- 3303 Grantham Dr
- 3209 Grantham Dr
- 3208 Grantham Dr
- 103 Sunset Dr
- 5801 Grantham Ct
- 5803 Grantham Ct
- 5805 Grantham Ct
- 3212 Abingdon Dr
- 3305 Grantham Dr
- 3210 Abingdon Dr
Your Personal Tour Guide
Ask me questions while you tour the home.