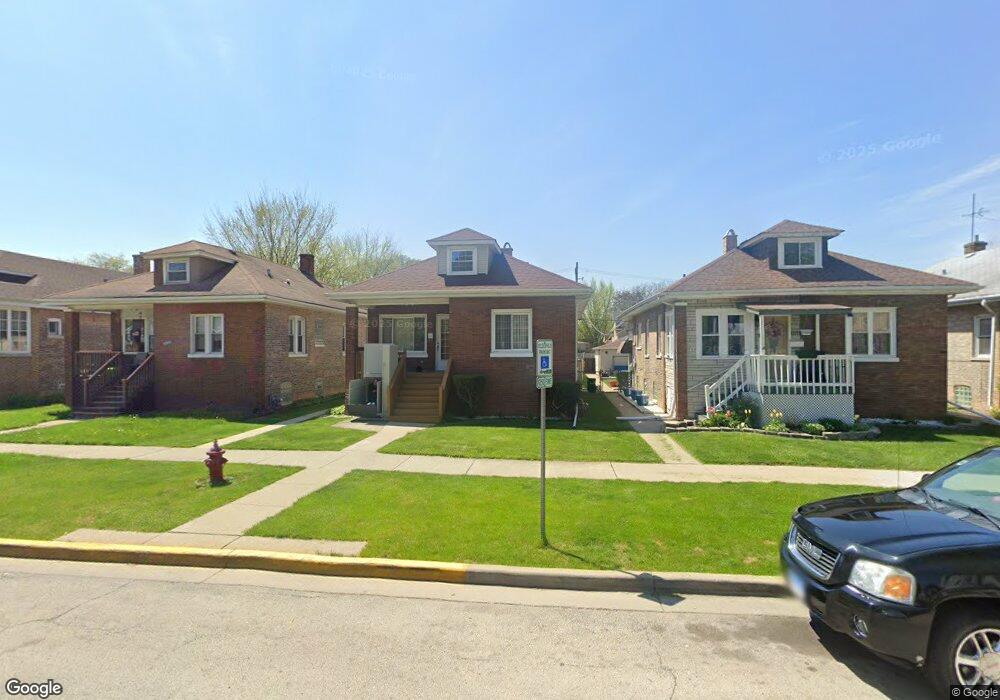
3216 Harvey Ave Berwyn, IL 60402
Estimated Value: $213,000 - $303,000
2
Beds
2
Baths
819
Sq Ft
$333/Sq Ft
Est. Value
About This Home
This home is located at 3216 Harvey Ave, Berwyn, IL 60402 and is currently estimated at $272,724, approximately $332 per square foot. 3216 Harvey Ave is a home located in Cook County with nearby schools including Irving Elementary School, Heritage Middle School, and J Sterling Morton Freshman Center.
Ownership History
Date
Name
Owned For
Owner Type
Purchase Details
Closed on
Aug 14, 2003
Sold by
Pinzon Armando and Pinzon Maria
Bought by
Pinzon Armando and Pinzon Maria
Current Estimated Value
Home Financials for this Owner
Home Financials are based on the most recent Mortgage that was taken out on this home.
Original Mortgage
$156,800
Interest Rate
6.4%
Mortgage Type
Unknown
Purchase Details
Closed on
Apr 9, 2002
Sold by
Escamilla Francisco J and Escamilla Alma
Bought by
Pinzon Armando and Pinzon Maria
Home Financials for this Owner
Home Financials are based on the most recent Mortgage that was taken out on this home.
Original Mortgage
$152,600
Interest Rate
7.16%
Mortgage Type
FHA
Purchase Details
Closed on
Jun 3, 1996
Sold by
Cardoza Fred and Cardoza Maria
Bought by
Escamilla Francisco J and Escamilla Alma
Home Financials for this Owner
Home Financials are based on the most recent Mortgage that was taken out on this home.
Original Mortgage
$111,625
Interest Rate
8.05%
Create a Home Valuation Report for This Property
The Home Valuation Report is an in-depth analysis detailing your home's value as well as a comparison with similar homes in the area
Home Values in the Area
Average Home Value in this Area
Purchase History
| Date | Buyer | Sale Price | Title Company |
|---|---|---|---|
| Pinzon Armando | -- | Git | |
| Pinzon Armando | $155,000 | -- | |
| Escamilla Francisco J | $117,500 | -- |
Source: Public Records
Mortgage History
| Date | Status | Borrower | Loan Amount |
|---|---|---|---|
| Closed | Pinzon Armando | $156,800 | |
| Closed | Pinzon Armando | $152,600 | |
| Previous Owner | Escamilla Francisco J | $111,625 |
Source: Public Records
Tax History Compared to Growth
Tax History
| Year | Tax Paid | Tax Assessment Tax Assessment Total Assessment is a certain percentage of the fair market value that is determined by local assessors to be the total taxable value of land and additions on the property. | Land | Improvement |
|---|---|---|---|---|
| 2024 | $6,679 | $22,000 | $5,788 | $16,212 |
| 2023 | $7,384 | $22,000 | $5,788 | $16,212 |
| 2022 | $7,384 | $19,670 | $5,079 | $14,591 |
| 2021 | $7,203 | $19,670 | $5,079 | $14,591 |
| 2020 | $6,902 | $19,670 | $5,079 | $14,591 |
| 2019 | $5,036 | $14,604 | $4,606 | $9,998 |
| 2018 | $4,738 | $14,604 | $4,606 | $9,998 |
| 2017 | $4,875 | $14,604 | $4,606 | $9,998 |
| 2016 | $4,363 | $12,558 | $3,780 | $8,778 |
| 2015 | $4,223 | $12,558 | $3,780 | $8,778 |
| 2014 | $4,096 | $12,558 | $3,780 | $8,778 |
| 2013 | $3,826 | $13,125 | $3,780 | $9,345 |
Source: Public Records
Map
Nearby Homes
- 3206 Highland Ave
- 3213 Cuyler Ave
- 3141 Harvey Ave
- 3310 Highland Ave
- 3247 Ridgeland Ave
- 3329 S Lombard Ave
- 3401 Ridgeland Ave
- 3447 Ridgeland Ave Unit 301
- 2834 Highland Ave
- 3218 Scoville Ave
- 6139 W 35th St
- 3518 Harvey Ave
- 6525 34th St
- 3240 East Ave
- 3506 Elmwood Ave
- 2802 Cuyler Ave
- 3530 Lombard Ave
- 6404 28th St
- 5919 W Ogden Ave
- 2737 Harvey Ave
- 3212 Harvey Ave
- 3218 Harvey Ave
- 3220 Harvey Ave
- 3208 Harvey Ave
- 3222 Harvey Ave
- 3206 Harvey Ave
- 3226 Harvey Ave
- 3211 Highland Ave
- 3213 Highland Ave
- 3209 Highland Ave
- 3207 Highland Ave
- 3217 Highland Ave Unit 2
- 3217 Highland Ave
- 3221 Highland Ave
- 3228 Harvey Ave
- 3230 Harvey Ave
- 3213 Harvey Ave
- 3211 Harvey Ave
- 3217 Harvey Ave
- 3219 Harvey Ave