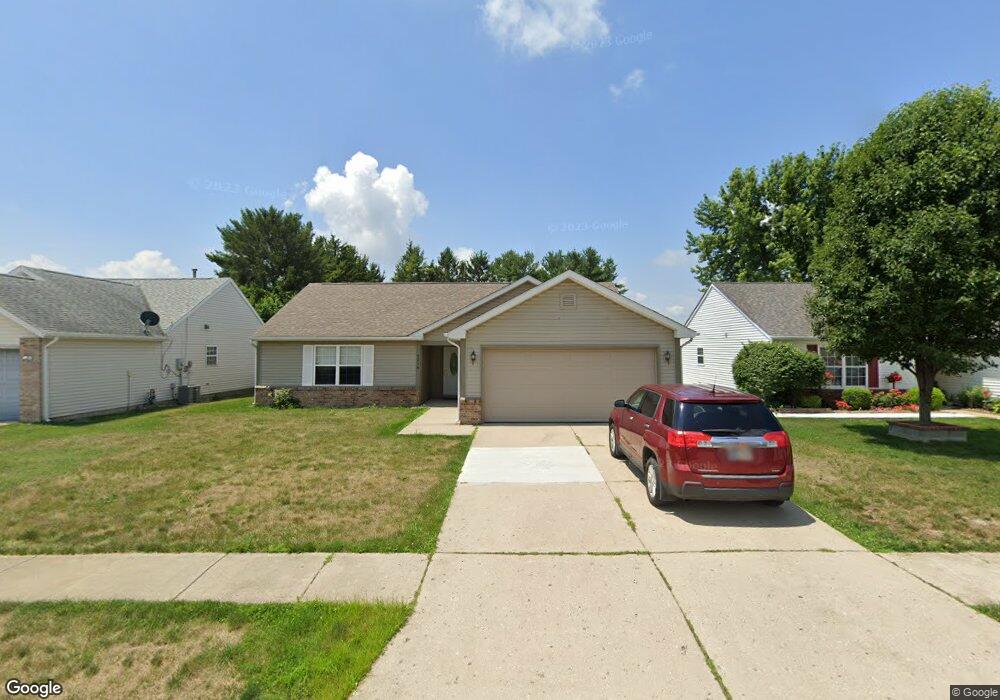
3216 Jordy Dr Lafayette, IN 47909
Old Romney NeighborhoodEstimated Value: $244,623 - $246,000
--
Bed
--
Bath
1,264
Sq Ft
$194/Sq Ft
Est. Value
About This Home
This home is located at 3216 Jordy Dr, Lafayette, IN 47909 and is currently estimated at $245,406, approximately $194 per square foot. 3216 Jordy Dr is a home located in Tippecanoe County with nearby schools including Mayflower Mill Elementary School, Southwestern Middle School, and McCutcheon High School.
Ownership History
Date
Name
Owned For
Owner Type
Purchase Details
Closed on
Apr 30, 2004
Sold by
Haywood Stephanie S
Bought by
Scott Candace L
Current Estimated Value
Home Financials for this Owner
Home Financials are based on the most recent Mortgage that was taken out on this home.
Original Mortgage
$78,000
Outstanding Balance
$15,784
Interest Rate
4%
Mortgage Type
Unknown
Estimated Equity
$229,622
Purchase Details
Closed on
Jul 30, 2002
Sold by
Majestic Properties Inc
Bought by
Haywood Stephanie S
Home Financials for this Owner
Home Financials are based on the most recent Mortgage that was taken out on this home.
Original Mortgage
$92,162
Interest Rate
6.7%
Mortgage Type
FHA
Purchase Details
Closed on
Mar 8, 2001
Sold by
Hud
Bought by
Majestic Properties Inc
Create a Home Valuation Report for This Property
The Home Valuation Report is an in-depth analysis detailing your home's value as well as a comparison with similar homes in the area
Home Values in the Area
Average Home Value in this Area
Purchase History
| Date | Buyer | Sale Price | Title Company |
|---|---|---|---|
| Scott Candace L | -- | -- | |
| Haywood Stephanie S | -- | -- | |
| Majestic Properties Inc | -- | -- |
Source: Public Records
Mortgage History
| Date | Status | Borrower | Loan Amount |
|---|---|---|---|
| Open | Scott Candace L | $78,000 | |
| Previous Owner | Haywood Stephanie S | $92,162 | |
| Closed | Scott Candace L | $25,000 |
Source: Public Records
Tax History Compared to Growth
Tax History
| Year | Tax Paid | Tax Assessment Tax Assessment Total Assessment is a certain percentage of the fair market value that is determined by local assessors to be the total taxable value of land and additions on the property. | Land | Improvement |
|---|---|---|---|---|
| 2024 | $1,875 | $187,500 | $39,200 | $148,300 |
| 2023 | $1,692 | $175,200 | $39,200 | $136,000 |
| 2022 | $1,320 | $137,100 | $18,000 | $119,100 |
| 2021 | $1,146 | $124,700 | $18,000 | $106,700 |
| 2020 | $1,006 | $117,600 | $18,000 | $99,600 |
| 2019 | $929 | $113,000 | $18,000 | $95,000 |
| 2018 | $839 | $108,300 | $18,000 | $90,300 |
| 2017 | $736 | $100,300 | $18,000 | $82,300 |
| 2016 | $712 | $100,100 | $18,000 | $82,100 |
| 2014 | $621 | $95,100 | $18,000 | $77,100 |
| 2013 | $581 | $91,300 | $18,000 | $73,300 |
Source: Public Records
Map
Nearby Homes
- 20 Carolyn Ct
- 324 Persimmon Trail
- 3267 Hendrickson Ln
- 312 Hibiscus Dr
- 617 Stockbridge Ln
- 116 Wise Dr
- 3428 Ingram Ct
- 3219 Turnbull Way
- 2820 Limestone Ln
- 126 Kensal Ct
- 3638 Round Rock Ct
- 2830 Duroc Dr Unit A
- 304 Jersey Ln
- 3416 Coventry Ln
- 318 Thames Ave
- 2561 S 231 Hwy
- 1100 W 275 S
- 2514 Eckman Dr
- 125 Durkees Run Dr
- 904 N Southland Dr
- 3212 Jordy Dr
- 3220 Jordy Dr
- 3224 Jordy Dr
- 3241 Old Romney Rd
- 108 Leora Ln
- 100 Leona Ln
- 3213 Jordy Dr
- 112 Triple Jay Dr
- 116 Triple Jay Dr
- 3204 Jordy Dr
- 3209 Jordy Dr
- 104 Leora Ln
- 131 Triple Jay Dr
- 109 Leora Ln
- 120 Triple Jay Dr
- 3200 Jordy Dr
- 124 Triple Jay Dr
- 3214 Jacob Place
- 105 Leora Ln
- 100 Leora Ln