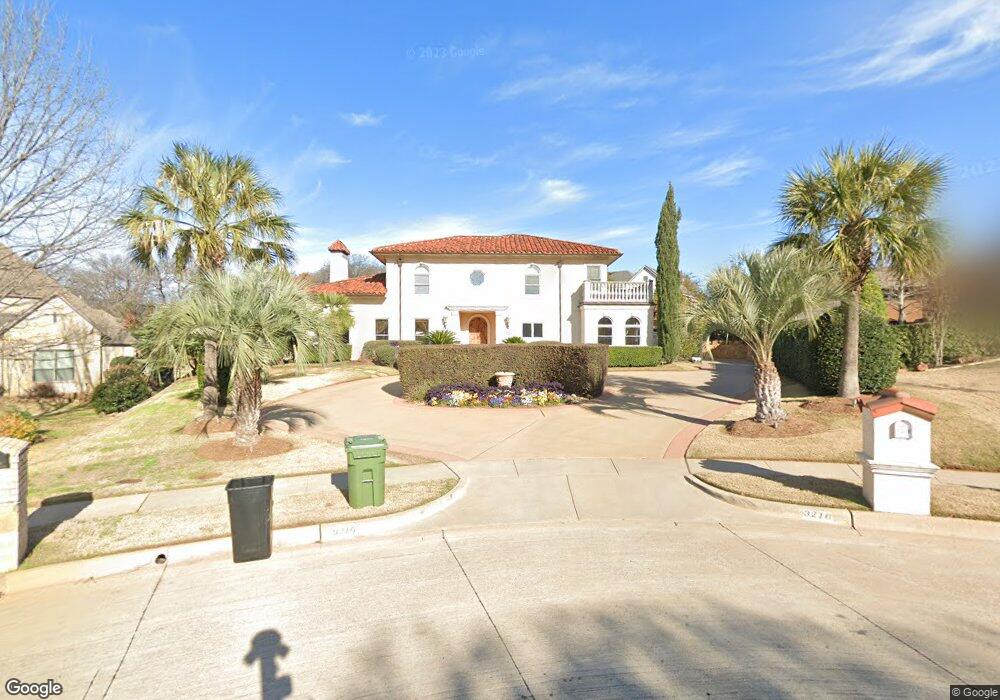
3216 Walker Place Grapevine, TX 76051
Estimated Value: $1,022,000 - $1,452,000
5
Beds
4
Baths
4,089
Sq Ft
$284/Sq Ft
Est. Value
About This Home
This home is located at 3216 Walker Place, Grapevine, TX 76051 and is currently estimated at $1,159,648, approximately $283 per square foot. 3216 Walker Place is a home located in Tarrant County with nearby schools including O.C. Taylor Elementary School, Cross Timbers Middle School, and Grapevine High School.
Ownership History
Date
Name
Owned For
Owner Type
Purchase Details
Closed on
Feb 23, 2005
Sold by
Cendant Mobility Financial Corp
Bought by
Sabanayagam Subharman
Current Estimated Value
Home Financials for this Owner
Home Financials are based on the most recent Mortgage that was taken out on this home.
Original Mortgage
$520,000
Interest Rate
5%
Mortgage Type
Purchase Money Mortgage
Purchase Details
Closed on
Dec 1, 2004
Sold by
Bengfort Joe R and Bengfort Gisela
Bought by
Cendant Mobility Financial Corp
Purchase Details
Closed on
Oct 5, 2001
Sold by
Bayley Yandell Ltd
Bought by
Bengfort Joe R and Bengfort Gisela
Create a Home Valuation Report for This Property
The Home Valuation Report is an in-depth analysis detailing your home's value as well as a comparison with similar homes in the area
Home Values in the Area
Average Home Value in this Area
Purchase History
| Date | Buyer | Sale Price | Title Company |
|---|---|---|---|
| Sabanayagam Subharman | -- | Allegiance Title Co | |
| Cendant Mobility Financial Corp | -- | Allegiance Title Co | |
| Bengfort Joe R | -- | Republic Title Of Texas Inc | |
| Bayley Yandell Ltd | -- | Republic Title Of Texas Inc |
Source: Public Records
Mortgage History
| Date | Status | Borrower | Loan Amount |
|---|---|---|---|
| Previous Owner | Sabanayagam Subharman | $520,000 | |
| Closed | Sabanayagam Subharman | $97,500 |
Source: Public Records
Tax History
| Year | Tax Paid | Tax Assessment Tax Assessment Total Assessment is a certain percentage of the fair market value that is determined by local assessors to be the total taxable value of land and additions on the property. | Land | Improvement |
|---|---|---|---|---|
| 2025 | $3,293 | $808,719 | $229,600 | $579,119 |
| 2024 | $3,293 | $808,719 | $229,600 | $579,119 |
| 2023 | $11,168 | $811,316 | $229,600 | $581,716 |
| 2022 | $13,730 | $730,425 | $229,600 | $500,825 |
| 2021 | $13,698 | $630,001 | $137,760 | $492,241 |
| 2020 | $13,857 | $630,000 | $137,760 | $492,240 |
| 2019 | $14,085 | $617,636 | $110,000 | $507,636 |
| 2018 | $3,565 | $599,704 | $110,000 | $489,704 |
| 2017 | $14,115 | $610,343 | $165,000 | $445,343 |
| 2016 | $14,095 | $609,476 | $165,000 | $444,476 |
| 2015 | $12,487 | $569,500 | $80,000 | $489,500 |
| 2014 | $12,487 | $569,500 | $80,000 | $489,500 |
Source: Public Records
Map
Nearby Homes
- 3904 Wagon Wheel Dr
- 3218 Mapleridge Dr
- 3920 Kelsey Ct
- 3509 Hightimber Dr
- 3502 Fieldwood St
- 3400 Wt Parr Rd
- 4147 Cedar Dr
- 4151 Cedar Dr
- 4150 Cedar Dr
- 3446 Spring Willow Dr
- 2902 Summertree Ln
- 3028 Mountainview Ct
- 3020 Northview Dr
- 4019 Whitby Ln
- 2817 Kingswood Dr
- 3229 Birch Ave
- 3206 Wintergreen Terrace
- 3104 Birch Ave
- 5809 N Ballantrae Dr
- 2805 Pine View Dr
- 3900 Wagon Wheel Dr
- 3212 Walker Place
- 3054 Monument Butte
- 3073 Hightimber Ct
- 3213 Walker Place
- 3053 Monument Butte
- 4112 Bentley Ct
- 3050 Monument Butte
- 3908 Wagon Wheel Dr
- 3208 Walker Place
- 3077 Hightimber Ct
- 3072 Hightimber Ct
- 4110 Bentley Ct
- 3209 Walker Place
- 3049 Monument Butte
- 4114 Bentley Ct
- 3912 Wagon Wheel Dr
- 3046 Monument Butte
- 3076 Hightimber Ct
- 3054 Sentinal Butte
Your Personal Tour Guide
Ask me questions while you tour the home.