
Landlord's Agent in 2023
Giovanni Laverde
Coldwell Banker Realty
(312) 320-5355
6 in this area
88 Total Sales


Estimated Value: $186,802 - $249,000
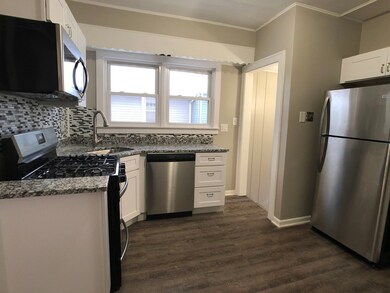
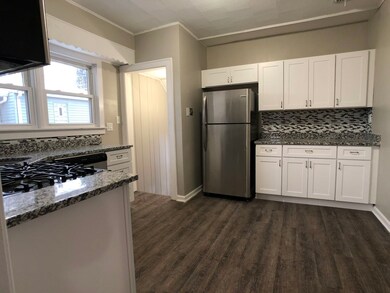
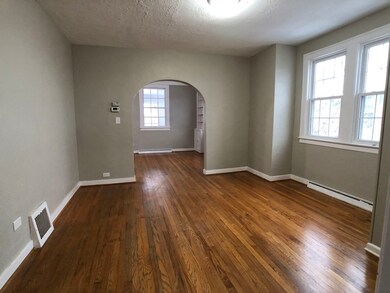
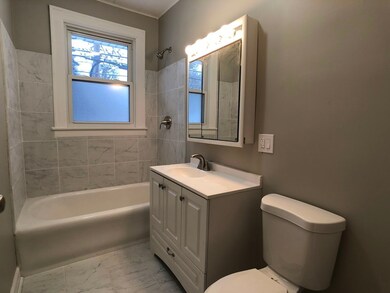
Section 8 Welcome! SPACIOUS Cape Cod home with 4 bedrooms and 2 baths located in the Village of Lansing. A desirable layout generously spread across two levels. Brand new refinished hardwood flooring throughout and each of the bedrooms has its own individual character. Central heat and AC. Entertaining is a dream in the updated kitchen with new cabinets, granite countertops, and stainless steel appliances. Full finished basement with additional family room space. Bonuses include a huge front porch, 2-car garage in the back with deck, patio, and a privacy gate in the backyard.
Last Agent to Rent the Property
Coldwell Banker Realty License #475127376 Listed on: 02/23/2023
| Date | Buyer | Sale Price | Title Company |
|---|---|---|---|
| Jgl Re Holdings Llc | -- | Fidelity National Title Co | |
| Secretary Of Veterans Affairs | -- | Attorney | |
| Wells Fargo Bank N A | -- | None Available | |
| Hall Craig Y | $116,000 | First American Title Insuran | |
| Rich Justin D | $90,000 | -- |
| Date | Status | Borrower | Loan Amount |
|---|---|---|---|
| Open | Jgl Re Holdings Llc | $93,000 | |
| Previous Owner | Hall Craig Y | $115,900 | |
| Previous Owner | Rich Justin D | $70,000 |
| Date | Event | Price | List to Sale | Price per Sq Ft | Prior Sale |
|---|---|---|---|---|---|
| 03/17/2023 03/17/23 | Rented | $1,900 | 0.0% | -- | |
| 03/13/2023 03/13/23 | Under Contract | -- | -- | -- | |
| 02/23/2023 02/23/23 | For Rent | $1,900 | +0.5% | -- | |
| 07/29/2022 07/29/22 | Rented | $1,890 | +2.2% | -- | |
| 07/20/2022 07/20/22 | Under Contract | -- | -- | -- | |
| 07/13/2022 07/13/22 | Price Changed | $1,850 | +2.8% | $1 / Sq Ft | |
| 07/13/2022 07/13/22 | For Rent | $1,800 | 0.0% | -- | |
| 07/12/2022 07/12/22 | Off Market | $1,800 | -- | -- | |
| 07/12/2022 07/12/22 | For Rent | $1,800 | 0.0% | -- | |
| 08/12/2019 08/12/19 | Sold | $65,000 | 0.0% | $44 / Sq Ft | View Prior Sale |
| 07/17/2019 07/17/19 | Pending | -- | -- | -- | |
| 06/26/2019 06/26/19 | For Sale | $65,000 | -43.9% | $44 / Sq Ft | |
| 01/24/2013 01/24/13 | Sold | $115,900 | +0.9% | $104 / Sq Ft | View Prior Sale |
| 09/28/2012 09/28/12 | Pending | -- | -- | -- | |
| 08/02/2012 08/02/12 | For Sale | $114,900 | -- | $103 / Sq Ft |
| Year | Tax Paid | Tax Assessment Tax Assessment Total Assessment is a certain percentage of the fair market value that is determined by local assessors to be the total taxable value of land and additions on the property. | Land | Improvement |
|---|---|---|---|---|
| 2024 | $6,773 | $14,001 | $3,438 | $10,563 |
| 2023 | $6,515 | $14,001 | $3,438 | $10,563 |
| 2022 | $6,515 | $10,025 | $2,969 | $7,056 |
| 2021 | $6,337 | $10,024 | $2,968 | $7,056 |
| 2020 | $5,881 | $10,024 | $2,968 | $7,056 |
| 2019 | $6,839 | $12,013 | $2,500 | $9,513 |
| 2018 | $6,713 | $12,013 | $2,500 | $9,513 |
| 2017 | $6,778 | $12,013 | $2,500 | $9,513 |
| 2016 | $0 | $11,600 | $2,343 | $9,257 |
| 2015 | $0 | $11,600 | $2,343 | $9,257 |
| 2014 | $2,687 | $11,600 | $2,343 | $9,257 |
| 2013 | $3,865 | $11,213 | $2,343 | $8,870 |
Landlord's Agent in 2023
Giovanni Laverde
Coldwell Banker Realty
(312) 320-5355
6 in this area
88 Total Sales
Tenant's Agent in 2023
Stephani Jeffery
Keller Williams ONEChicago
(312) 609-9850
27 Total Sales
Buyer's Agent in 2022
Pamela Perkins
Pamela D. Perkins
(312) 388-1841
9 Total Sales
M
Seller's Agent in 2019
Michael Campbell
DPA Realty LLC
Seller's Agent in 2013
Tony Mitidiero
eXp Realty
(708) 259-3734
8 in this area
166 Total Sales
M
Buyer's Agent in 2013
Melissa Gray
Melissa Gray
Source: Midwest Real Estate Data (MRED)
MLS Number: 11724774
APN: 30-32-316-018-0000
Disclaimer: Certain information contained herein is derived from information provided by parties other than Homes.com. All information provided is deemed reliable, but is not guaranteed to be accurate and should be independently verified.
![]() Based on information submitted to the MLS GRID. All data is obtained from various sources and may not have been verified by broker or MLS GRID. Supplied Open House Information is subject to change without notice. All information should be independently reviewed and verified for accuracy. Properties may or may not be listed by the office/agent presenting the information. Some IDX listings have been excluded from this website.
Based on information submitted to the MLS GRID. All data is obtained from various sources and may not have been verified by broker or MLS GRID. Supplied Open House Information is subject to change without notice. All information should be independently reviewed and verified for accuracy. Properties may or may not be listed by the office/agent presenting the information. Some IDX listings have been excluded from this website.
The Digital Millennium Copyright Act of 1998, 17 U.S.C. § 512 (the “DMCA”) provides recourse for copyright owners who believe that material appearing on the Internet infringes their rights under U.S. copyright law. If you believe in good faith that any content or material made available in connection with our website or services infringes your copyright, you (or your agent) may send us a notice requesting that the content or material be removed, or access to it blocked.
Notices must be sent in writing by email to DMCAnotice@MLSGrid.com.
The DMCA requires that your notice of alleged copyright infringement include the following information:
(1) description of the copyrighted work that is the subject of claimed infringement;
(2) description of the alleged infringing content and information sufficient to permit us to locate the content;
(3) contact information for you, including your address, telephone number and email address;
(4) a statement by you that you have a good faith belief that the content in the manner complained of is not authorized by the copyright owner, or its agent, or by the operation of any law;
(5) a statement by you, signed under penalty of perjury, that the information in the notification is accurate and that you have the authority to enforce the copyrights that are claimed to be infringed; and
(6) a physical or electronic signature of the copyright owner or a person authorized to act on the copyright owner’s behalf. Failure to include all of the above information may result in the delay of the processing of your complaint.