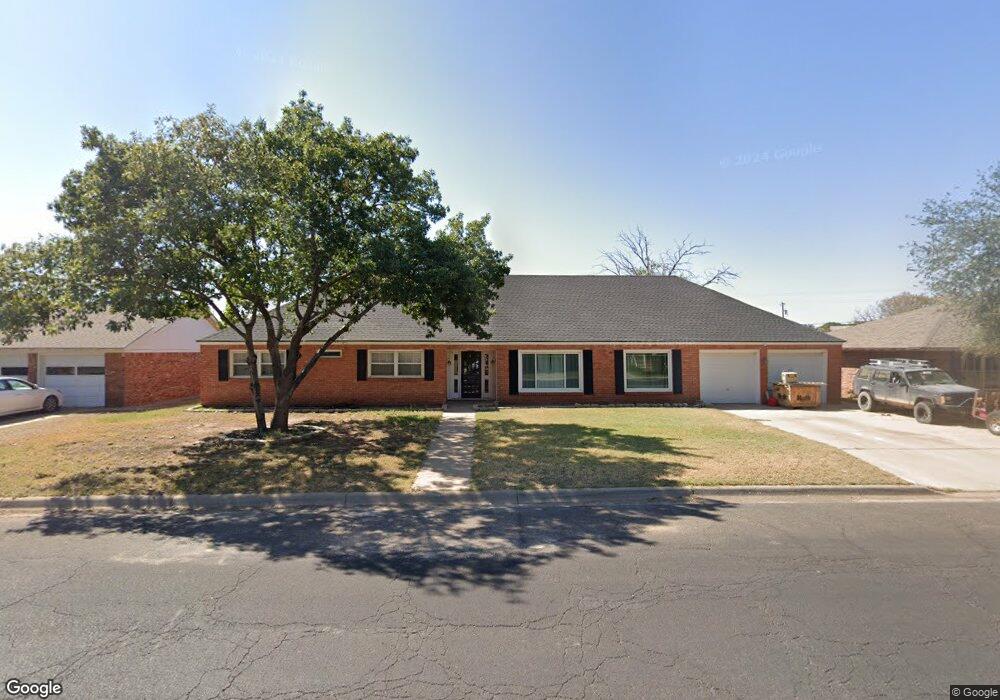
3217 Apperson Dr Midland, TX 79705
Estimated Value: $351,121 - $409,000
Studio
2
Baths
2,429
Sq Ft
$156/Sq Ft
Est. Value
About This Home
This home is located at 3217 Apperson Dr, Midland, TX 79705 and is currently estimated at $378,530, approximately $155 per square foot. 3217 Apperson Dr is a home located in Midland County with nearby schools including Emerson Elementary School, Midland High School, and Midland Freshman High School.
Ownership History
Date
Name
Owned For
Owner Type
Purchase Details
Closed on
Sep 10, 2019
Sold by
Johnson Kris and Johnson Allison
Bought by
Ritts Ted W and Ritts Lydia P
Current Estimated Value
Home Financials for this Owner
Home Financials are based on the most recent Mortgage that was taken out on this home.
Original Mortgage
$312,240
Outstanding Balance
$273,465
Interest Rate
3.7%
Mortgage Type
FHA
Estimated Equity
$105,065
Purchase Details
Closed on
Nov 16, 2012
Sold by
Adams Terri Ann and Adams Amy Lee
Bought by
Johnson Kris
Home Financials for this Owner
Home Financials are based on the most recent Mortgage that was taken out on this home.
Original Mortgage
$201,261
Interest Rate
3.37%
Mortgage Type
FHA
Purchase Details
Closed on
Feb 26, 2012
Sold by
Adams Jean Hayden Ward
Bought by
Adams Terri Ann and Adams Amy Lee
Purchase Details
Closed on
Oct 1, 1965
Bought by
Johnson Kris
Create a Home Valuation Report for This Property
The Home Valuation Report is an in-depth analysis detailing your home's value as well as a comparison with similar homes in the area
Purchase History
| Date | Buyer | Sale Price | Title Company |
|---|---|---|---|
| Ritts Ted W | -- | West Texas Abstract | |
| Johnson Kris | -- | None Available | |
| Adams Terri Ann | -- | None Available | |
| Johnson Kris | -- | -- |
Source: Public Records
Mortgage History
| Date | Status | Borrower | Loan Amount |
|---|---|---|---|
| Open | Ritts Ted W | $312,240 | |
| Previous Owner | Johnson Kris | $201,261 |
Source: Public Records
Tax History
| Year | Tax Paid | Tax Assessment Tax Assessment Total Assessment is a certain percentage of the fair market value that is determined by local assessors to be the total taxable value of land and additions on the property. | Land | Improvement |
|---|---|---|---|---|
| 2025 | $4,004 | $263,650 | $39,550 | $224,100 |
| 2024 | $2,997 | $271,510 | $39,550 | $231,960 |
| 2023 | $2,877 | $266,730 | $39,550 | $227,180 |
| 2022 | $3,834 | $245,380 | $39,550 | $205,830 |
| 2021 | $4,156 | $238,550 | $39,550 | $199,000 |
| 2019 | $4,677 | $247,020 | $39,550 | $207,470 |
| 2018 | $4,426 | $227,630 | $39,550 | $188,080 |
| 2017 | $4,171 | $214,530 | $39,550 | $174,980 |
| 2016 | $4,047 | $215,760 | $39,550 | $176,210 |
| 2015 | -- | $206,230 | $39,550 | $166,680 |
| 2014 | -- | $200,990 | $39,550 | $161,440 |
Source: Public Records
Map
Nearby Homes
- 3215 Durant Dr
- 3207 Marmon Dr
- 3117 Auburn Dr
- 3203 Maxwell Dr
- 2827 Durant Dr
- 3402 Woodhaven Dr
- 2821 Marmon Dr
- 3225 Camarie Ave
- 5 Quail Run
- 6803 Cape Dyer Ln
- 3404 Northfield Dr
- 3 Marinor Ct
- 3103 Metz Dr
- 2811 Durant Dr
- 4 Amhurst Ct
- 2800 Durant Dr
- 3227 W Dengar Ave
- 3231 W Dengar Ave
- 2815 Metz Dr
- 3002 Moss Ave
- 3219 Apperson Dr
- 3215 Apperson Dr
- 3218 Apperson Dr
- 3216 Apperson Dr
- 3221 Apperson Dr
- 3213 Apperson Dr
- 3220 Apperson Dr
- 3214 Apperson Dr
- 3223 Apperson Dr
- 3222 Apperson Dr
- 3211 Apperson Dr
- 3212 Apperson Dr
- 3221 Maxwell Dr
- 3307 Cord Dr
- 3223 Maxwell Dr
- 3305 Cord Dr
- 3213 Durant Dr
- 3210 Apperson Dr
- 3211 Durant Dr
- 3217 Durant Dr
Your Personal Tour Guide
Ask me questions while you tour the home.