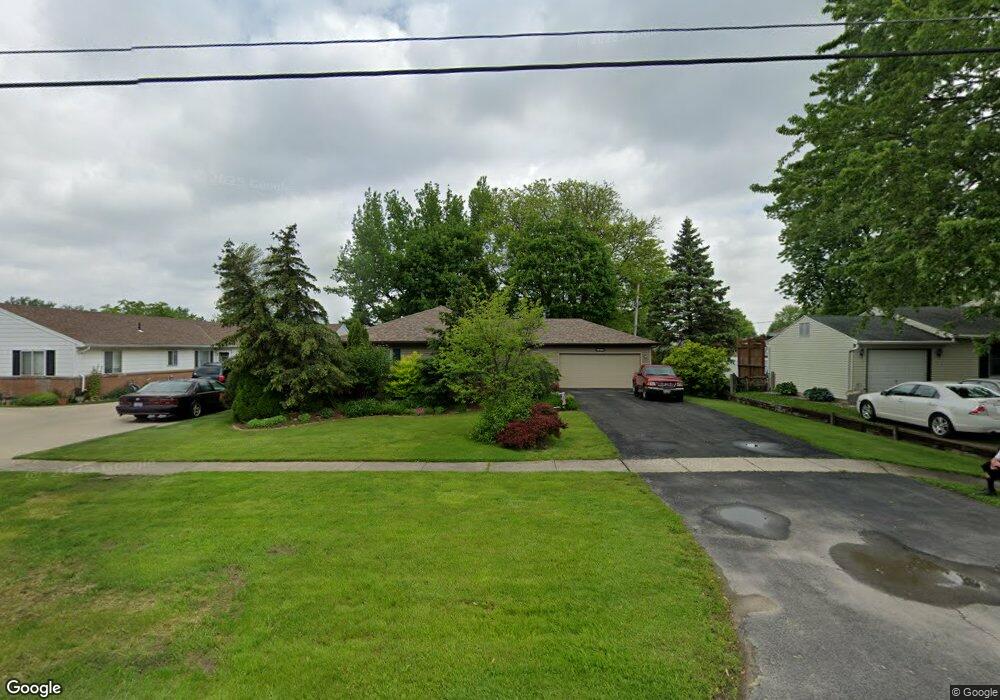
3217 Brown Rd Oregon, OH 43616
Estimated Value: $254,000 - $301,000
3
Beds
2
Baths
1,544
Sq Ft
$174/Sq Ft
Est. Value
About This Home
This home is located at 3217 Brown Rd, Oregon, OH 43616 and is currently estimated at $269,101, approximately $174 per square foot. 3217 Brown Rd is a home located in Lucas County with nearby schools including St. Kateri Catholic Schools.
Ownership History
Date
Name
Owned For
Owner Type
Purchase Details
Closed on
Jul 11, 2022
Sold by
Sharp Revocable Trust and Heidebrink Marsha
Bought by
Atkinson Jessica E and Boudreaux Christopher A
Current Estimated Value
Home Financials for this Owner
Home Financials are based on the most recent Mortgage that was taken out on this home.
Original Mortgage
$218,870
Outstanding Balance
$207,315
Interest Rate
5.09%
Mortgage Type
VA
Estimated Equity
$61,786
Purchase Details
Closed on
Jun 30, 2017
Sold by
Tilton Michael T and Ziegelhofer Kimberly R
Bought by
Sharp Judith A and The Sharp Revocable Trust
Purchase Details
Closed on
Aug 11, 2005
Sold by
Stroshine Emery T and Stroshine Barbara Ann
Bought by
Tilton Michael T and Tilton Kimberly R
Home Financials for this Owner
Home Financials are based on the most recent Mortgage that was taken out on this home.
Original Mortgage
$157,000
Interest Rate
5.8%
Mortgage Type
Purchase Money Mortgage
Create a Home Valuation Report for This Property
The Home Valuation Report is an in-depth analysis detailing your home's value as well as a comparison with similar homes in the area
Home Values in the Area
Average Home Value in this Area
Purchase History
| Date | Buyer | Sale Price | Title Company |
|---|---|---|---|
| Atkinson Jessica E | $215,000 | None Listed On Document | |
| Sharp Judith A | $143,300 | None Available | |
| Tilton Michael T | $157,000 | Chicago Title Insurance Comp |
Source: Public Records
Mortgage History
| Date | Status | Borrower | Loan Amount |
|---|---|---|---|
| Open | Atkinson Jessica E | $218,870 | |
| Previous Owner | Tilton Michael T | $157,000 |
Source: Public Records
Tax History
| Year | Tax Paid | Tax Assessment Tax Assessment Total Assessment is a certain percentage of the fair market value that is determined by local assessors to be the total taxable value of land and additions on the property. | Land | Improvement |
|---|---|---|---|---|
| 2025 | -- | $73,640 | $16,905 | $56,735 |
| 2024 | $1,754 | $73,640 | $16,905 | $56,735 |
| 2023 | $2,778 | $49,525 | $12,635 | $36,890 |
| 2022 | $2,315 | $49,525 | $12,635 | $36,890 |
| 2021 | $2,333 | $49,525 | $12,635 | $36,890 |
| 2020 | $2,351 | $45,290 | $11,340 | $33,950 |
| 2019 | $2,285 | $45,290 | $11,340 | $33,950 |
| 2018 | $2,577 | $45,290 | $11,340 | $33,950 |
| 2017 | $2,368 | $44,275 | $11,095 | $33,180 |
| 2016 | $2,897 | $126,500 | $31,700 | $94,800 |
| 2015 | $2,878 | $126,500 | $31,700 | $94,800 |
| 2014 | $2,646 | $43,410 | $10,890 | $32,520 |
| 2013 | $2,646 | $43,410 | $10,890 | $32,520 |
Source: Public Records
Map
Nearby Homes
- 3359 Bordeaux Rue
- 1236 Eastland Dr
- 3515 Brown Rd
- 1134 Laura Ln
- 1957 Carvelle Dr
- 1043 Lakeside Ln
- 1826 Reva Dr
- 2826 Olde Curtice Rd
- 3785 Ryan Place
- 230 Ritter Ave
- 2544 Cawdor Rd
- 1308 Oaktree Ct
- 3517 Goodrich Ave
- 1301 Oaktree Ct
- 3736 Navarre Ave
- 1450 S Lallendorf Rd
- 2432 Rochester Place
- 117 W Bridge Rd
- 2249 Pickle Rd
- 199 E Bridge Rd
- 3215 Brown Rd
- 3219 Brown Rd
- 1542 Forrester Dr
- 3213 Brown Rd
- 1536 Forrester Dr
- 1548 Forrester Dr
- 1520 Eastland Dr
- 3211 Brown Rd
- 1530 Forrester Dr
- 1516 Eastland Dr
- 3207 Brown Rd
- 3216 Brown Rd
- 1547 Forrester Dr
- 3220 Brown Rd
- 1512 Eastland Dr
- 1541 Forrester Dr
- 1513 Eastland Dr
- 1509 Eastland Dr
- 1535 Forrester Dr
- 1529 Forrester Dr
Your Personal Tour Guide
Ask me questions while you tour the home.