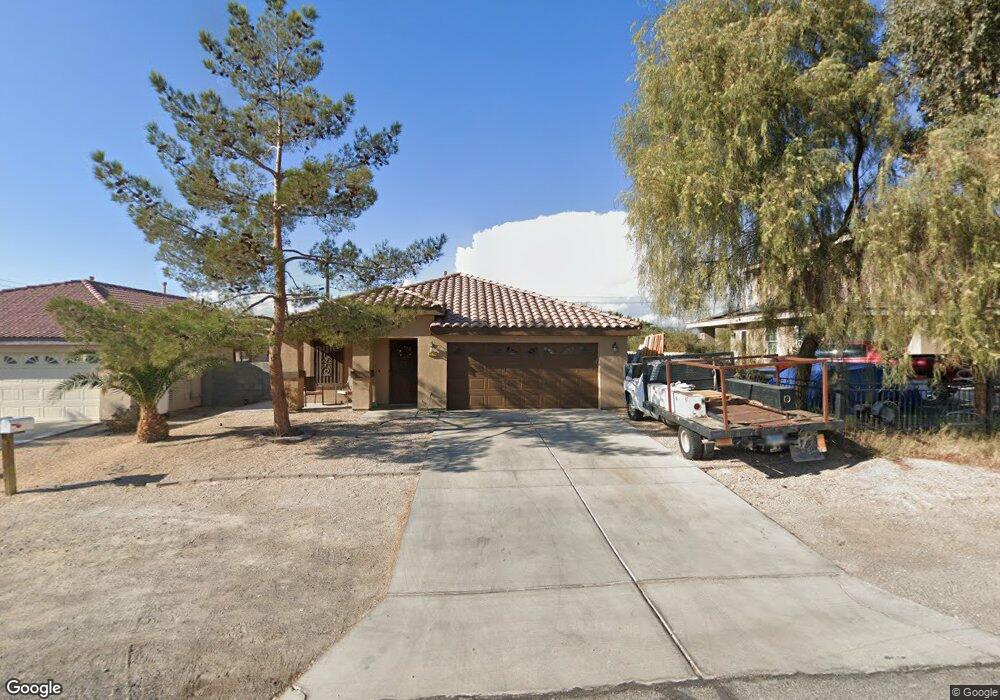
3217 Kemp St North Las Vegas, NV 89032
Cheyenne NeighborhoodEstimated Value: $374,691 - $419,000
3
Beds
2
Baths
1,576
Sq Ft
$249/Sq Ft
Est. Value
About This Home
This home is located at 3217 Kemp St, North Las Vegas, NV 89032 and is currently estimated at $392,923, approximately $249 per square foot. 3217 Kemp St is a home located in Clark County with nearby schools including Richard C. Priest Elementary School, Theron L Swainston Middle School, and Cheyenne High School.
Ownership History
Date
Name
Owned For
Owner Type
Purchase Details
Closed on
Sep 21, 2010
Sold by
Ruan Rivera Juan Alberto
Bought by
Duarte Leonel
Current Estimated Value
Home Financials for this Owner
Home Financials are based on the most recent Mortgage that was taken out on this home.
Original Mortgage
$98,671
Outstanding Balance
$67,780
Interest Rate
5.25%
Mortgage Type
FHA
Estimated Equity
$325,143
Purchase Details
Closed on
Jan 8, 2010
Sold by
Martinez Christian
Bought by
Ruan Rivera Juan Alberto
Purchase Details
Closed on
Sep 29, 2007
Sold by
Torres Alfonso and Torres Francisca
Bought by
Martinez Christian
Purchase Details
Closed on
Mar 1, 2005
Sold by
Chua Johnny and Chua Rowena
Bought by
Torres Alfonso and Torres Francisca
Create a Home Valuation Report for This Property
The Home Valuation Report is an in-depth analysis detailing your home's value as well as a comparison with similar homes in the area
Home Values in the Area
Average Home Value in this Area
Purchase History
| Date | Buyer | Sale Price | Title Company |
|---|---|---|---|
| Duarte Leonel | $100,000 | Lawyers Title Of Nevada Hen | |
| Ruan Rivera Juan Alberto | -- | Lawyers Title Of Nevada Hen | |
| Ruan Rivera Juan Alberto | $162,000 | None Available | |
| Martinez Christian | $162,000 | Title One | |
| Torres Alfonso | -- | -- |
Source: Public Records
Mortgage History
| Date | Status | Borrower | Loan Amount |
|---|---|---|---|
| Open | Duarte Leonel | $98,671 |
Source: Public Records
Tax History Compared to Growth
Tax History
| Year | Tax Paid | Tax Assessment Tax Assessment Total Assessment is a certain percentage of the fair market value that is determined by local assessors to be the total taxable value of land and additions on the property. | Land | Improvement |
|---|---|---|---|---|
| 2025 | $1,640 | $107,001 | $28,263 | $78,738 |
| 2024 | $1,593 | $107,001 | $28,263 | $78,738 |
| 2023 | $1,593 | $100,676 | $26,478 | $74,198 |
| 2022 | $1,621 | $88,492 | $20,825 | $67,667 |
| 2021 | $1,501 | $77,295 | $13,125 | $64,170 |
| 2020 | $1,391 | $72,895 | $9,450 | $63,445 |
| 2019 | $1,242 | $69,653 | $9,240 | $60,413 |
| 2018 | $1,185 | $65,820 | $7,770 | $58,050 |
| 2017 | $2,203 | $65,683 | $7,000 | $58,683 |
| 2016 | $1,110 | $51,791 | $8,575 | $43,216 |
| 2015 | $1,107 | $45,331 | $7,350 | $37,981 |
| 2014 | $1,073 | $62,603 | $4,900 | $57,703 |
Source: Public Records
Map
Nearby Homes
- 3304 Simmons St
- 1981 Komodo Dragon Ct
- 0 N Ernest St
- 3440 Ernest St
- 3439 Cox St
- 00 Ward
- 0 Clayton Unit 2712913
- 3104 W Colton Ave Unit 1
- 3355 Clayton St
- 3323 Outlook Point St
- 2906 Carothers Ct
- 3524 Simmons St
- 3301 W Colton Ave
- 3336 Cheyenne Gardens Way
- 3834 W Gowan Rd
- 0 Simmons & Logan 3 Unit 2722103
- 1854 Oak Bluffs Ave
- 410 Rocky Peak Dr Unit 1704
- 3306 Bridge House St
- 3505 Diamond Spur Ave