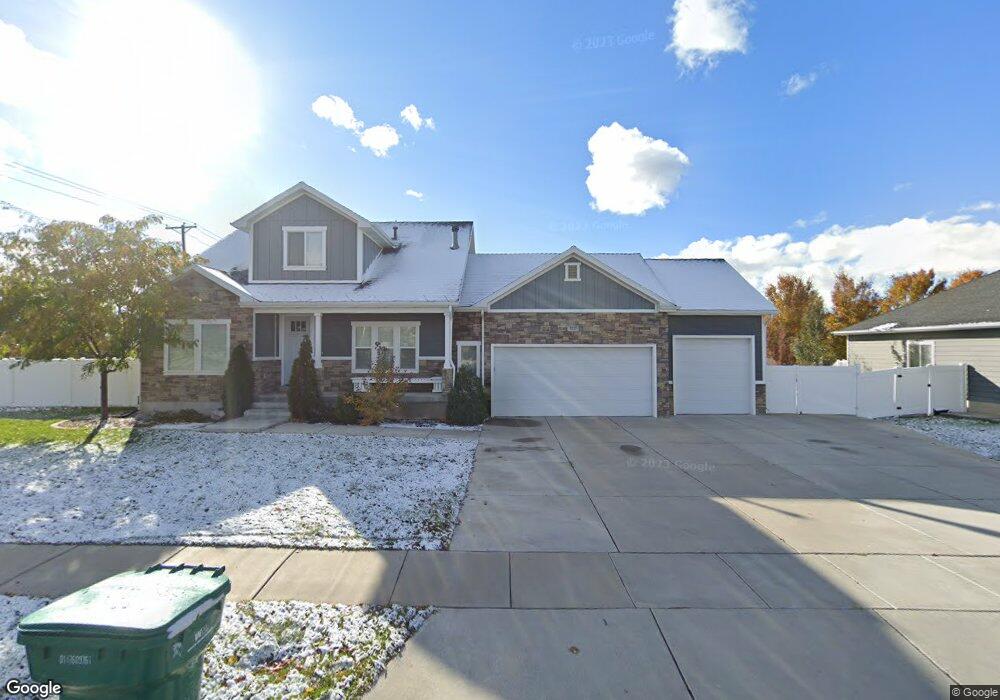
3217 W 275 N Layton, UT 84041
Estimated Value: $603,000 - $686,000
4
Beds
4
Baths
3,245
Sq Ft
$199/Sq Ft
Est. Value
About This Home
This home is located at 3217 W 275 N, Layton, UT 84041 and is currently estimated at $644,224, approximately $198 per square foot. 3217 W 275 N is a home located in Davis County with nearby schools including Sand Springs Elementary School, Legacy Junior High School, and Layton High School.
Ownership History
Date
Name
Owned For
Owner Type
Purchase Details
Closed on
Mar 1, 2017
Sold by
Judkins Zachery D and Judkins Lindsey M
Bought by
Haskell Wesley A and Haskell Noel B
Current Estimated Value
Purchase Details
Closed on
Oct 29, 2012
Sold by
Brighton Bank
Bought by
Judkins Zachery D and Judkins Lindsey M
Home Financials for this Owner
Home Financials are based on the most recent Mortgage that was taken out on this home.
Original Mortgage
$203,000
Interest Rate
3.43%
Mortgage Type
Seller Take Back
Purchase Details
Closed on
Jun 28, 2012
Sold by
Benchmark Real Estate Company
Bought by
Brighton Bank
Create a Home Valuation Report for This Property
The Home Valuation Report is an in-depth analysis detailing your home's value as well as a comparison with similar homes in the area
Home Values in the Area
Average Home Value in this Area
Purchase History
| Date | Buyer | Sale Price | Title Company |
|---|---|---|---|
| Haskell Wesley A | -- | -- | |
| Judkins Zachery D | -- | Founders Title Co L | |
| Brighton Bank | -- | Founders Title Co L |
Source: Public Records
Mortgage History
| Date | Status | Borrower | Loan Amount |
|---|---|---|---|
| Previous Owner | Judkins Zachery D | $203,000 |
Source: Public Records
Tax History Compared to Growth
Tax History
| Year | Tax Paid | Tax Assessment Tax Assessment Total Assessment is a certain percentage of the fair market value that is determined by local assessors to be the total taxable value of land and additions on the property. | Land | Improvement |
|---|---|---|---|---|
| 2025 | $3,002 | $315,150 | $124,132 | $191,018 |
| 2024 | $2,897 | $306,350 | $140,162 | $166,188 |
| 2023 | $2,897 | $540,000 | $147,594 | $392,406 |
| 2022 | $3,212 | $591,000 | $156,930 | $434,070 |
| 2021 | $3,014 | $455,000 | $129,451 | $325,549 |
| 2020 | $2,707 | $392,000 | $110,490 | $281,510 |
| 2019 | $2,672 | $379,000 | $109,514 | $269,486 |
| 2018 | $2,472 | $352,000 | $96,474 | $255,526 |
| 2016 | $2,232 | $163,955 | $39,883 | $124,072 |
| 2015 | $1,909 | $133,155 | $39,883 | $93,272 |
| 2014 | $1,982 | $141,351 | $39,883 | $101,468 |
| 2013 | -- | $65,296 | $40,379 | $24,917 |
Source: Public Records
Map
Nearby Homes
- 3239 W 275 N
- 3234 W 200 N
- 3220 W 275 N
- 3248 W 200 N
- 3248 W 200 N Unit 115
- 3242 W 275 N
- 3242 W 275 N Unit 212
- 3261 W 275 N Unit 203
- 3261 W 275 N
- 212 N 3225 W
- 212 N 3225 W Unit 113
- 3264 W 200 N
- 3264 W 200 N Unit 116
- 3266 W 275 N
- 194 N 3225 W
- 197 N 3225 W
- 197 N 3225 W Unit 118
- 256 N 3300 W
- 179 N 3225 W
- 179 N 3225 W Unit 119